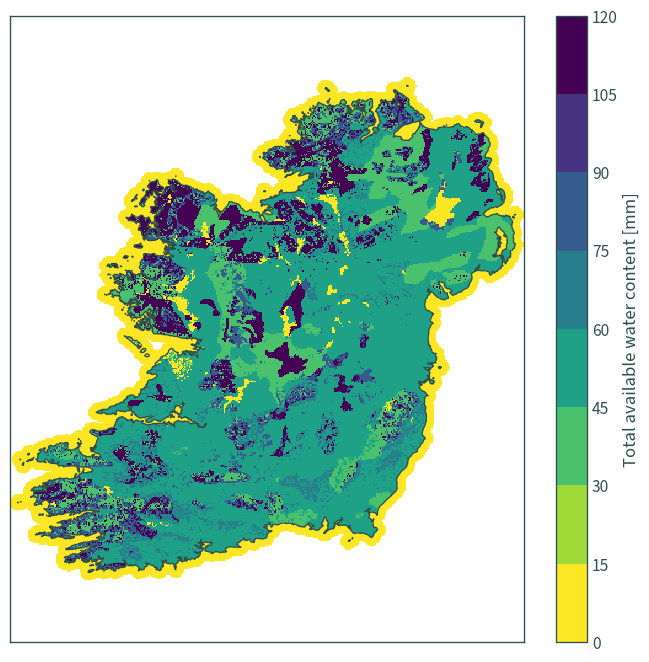
Soil water-holding capacity - gridded for HiResIreland#
European soil database derived data - total available water content (TAWC) for the topsoil [mm] (European Commission, n.d.; Hiederer, 2013a; Hiederer, 2013b): https://esdac.jrc.ec.europa.eu/content/european-soil-database-derived-data
import os
import matplotlib.pyplot as plt
import geopandas as gpd
import rioxarray as rxr
from rasterstats import zonal_stats
DATA_DIR = os.path.join("data", "soil", "european-soil-database-derived-data")
DATA_FILE = os.path.join(DATA_DIR, "IE_TAWC.tif")
data = rxr.open_rasterio(DATA_FILE, chunks="auto", masked=True)
data
<xarray.DataArray (band: 1, y: 409, x: 418)>
dask.array<open_rasterio-f60863f961dba41a45774b674cfc20e4<this-array>, shape=(1, 409, 418), dtype=float32, chunksize=(1, 409, 418), chunktype=numpy.ndarray>
Coordinates:
  * band         (band) int64 1
  * x            (x) float64 2.918e+06 2.92e+06 2.92e+06 ... 3.334e+06 3.336e+06
  * y            (y) float64 3.728e+06 3.728e+06 ... 3.322e+06 3.32e+06
    spatial_ref  int64 0
Attributes:
    AREA_OR_POINT:  Area
    units:          milimeter
    scale_factor:   1.0
add_offset: 0.0data.rio.crs
CRS.from_wkt('LOCAL_CS["Unknown",UNIT["metre",1,AUTHORITY["EPSG","9001"]],AXIS["Easting",EAST],AXIS["Northing",NORTH]]')
# ETRS 89 LAEA
data_crs = 3035
data.rio.write_crs(data_crs, inplace=True)
<xarray.DataArray (band: 1, y: 409, x: 418)>
dask.array<open_rasterio-f60863f961dba41a45774b674cfc20e4<this-array>, shape=(1, 409, 418), dtype=float32, chunksize=(1, 409, 418), chunktype=numpy.ndarray>
Coordinates:
  * band         (band) int64 1
  * x            (x) float64 2.918e+06 2.92e+06 2.92e+06 ... 3.334e+06 3.336e+06
  * y            (y) float64 3.728e+06 3.728e+06 ... 3.322e+06 3.32e+06
    spatial_ref  int64 0
Attributes:
    AREA_OR_POINT:  Area
    units:          milimeter
    scale_factor:   1.0
add_offset: 0.0data.rio.crs
CRS.from_epsg(3035)
data.rio.resolution()
(1000.0, -1000.0)
# Ireland boundary
GPKG_BOUNDARY = os.path.join("data", "boundaries", "boundaries_all.gpkg")
ie = gpd.read_file(GPKG_BOUNDARY, layer="NUTS_RG_01M_2021_2157_IE")
ie.crs
<Derived Projected CRS: EPSG:2157>
Name: IRENET95 / Irish Transverse Mercator
Axis Info [cartesian]:
- E[east]: Easting (metre)
- N[north]: Northing (metre)
Area of Use:
- name: Ireland - onshore. United Kingdom (UK) - Northern Ireland (Ulster) - onshore.
- bounds: (-10.56, 51.39, -5.34, 55.43)
Coordinate Operation:
- name: Irish Transverse Mercator
- method: Transverse Mercator
Datum: IRENET95
- Ellipsoid: GRS 1980
- Prime Meridian: Greenwich
data.max().values
array(117.38613, dtype=float32)
data.min().values
array(0., dtype=float32)
fig = data.plot(
    robust=True,
    cmap="viridis_r",
    figsize=(7, 7),
    levels=10,
    cbar_kwargs={"label": "Total available water content [mm]"},
)
ie.to_crs(data_crs).boundary.plot(
    ax=fig.axes, color="darkslategrey", linewidth=1
)
plt.title(None)
fig.axes.tick_params(labelbottom=False, labelleft=False)
plt.xlabel(None)
plt.ylabel(None)
plt.tight_layout()
plt.axis("equal")
plt.show()
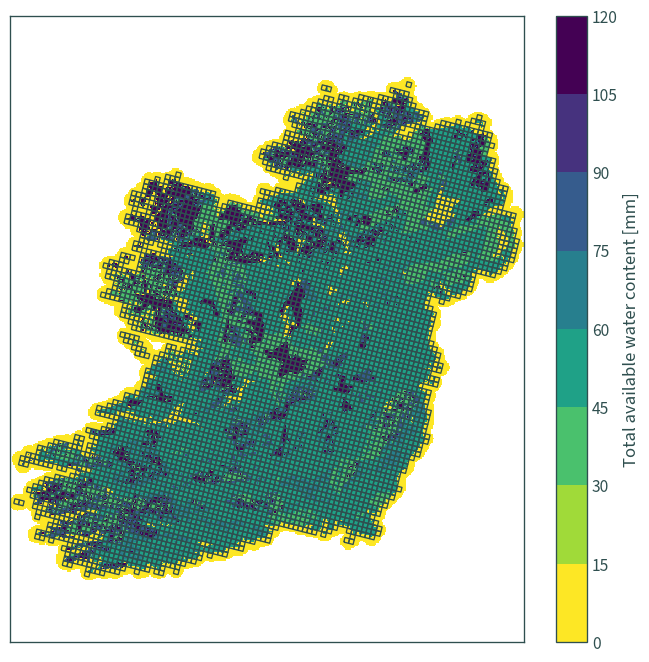
Grid cells#
grid_cells = gpd.read_file(
    os.path.join("data", "ModVege", "params.gpkg"), layer="hiresireland"
)
grid_cells.head()
| rlon | rlat | sr | ni | geometry | |
|---|---|---|---|---|---|
| 0 | -1.680 | -1.315 | 0.917024 | 0.35 | POLYGON ((417558.169 590305.235, 417549.771 59... |
| 1 | -1.680 | -1.280 | 0.917024 | 0.35 | POLYGON ((417549.771 594200.519, 417541.440 59... |
| 2 | -1.645 | -1.595 | 0.763591 | 0.35 | POLYGON ((421531.348 559152.004, 421522.478 56... |
| 3 | -1.645 | -1.315 | 0.917024 | 0.35 | POLYGON ((421462.259 590312.894, 421453.924 59... |
| 4 | -1.645 | -1.280 | 0.917024 | 0.35 | POLYGON ((421453.924 594208.111, 421445.655 59... |
grid_cells.crs
<Derived Projected CRS: EPSG:2157>
Name: IRENET95 / Irish Transverse Mercator
Axis Info [cartesian]:
- E[east]: Easting (metre)
- N[north]: Northing (metre)
Area of Use:
- name: Ireland - onshore. United Kingdom (UK) - Northern Ireland (Ulster) - onshore.
- bounds: (-10.56, 51.39, -5.34, 55.43)
Coordinate Operation:
- name: Irish Transverse Mercator
- method: Transverse Mercator
Datum: IRENET95
- Ellipsoid: GRS 1980
- Prime Meridian: Greenwich
grid_cells.shape
(6118, 5)
fig = data.plot(
    robust=True,
    cmap="viridis_r",
    figsize=(7, 7),
    levels=10,
    cbar_kwargs={"label": "Total available water content [mm]"},
)
grid_cells.to_crs(data_crs).boundary.plot(
    ax=fig.axes, color="darkslategrey", linewidth=1
)
plt.title(None)
fig.axes.tick_params(labelbottom=False, labelleft=False)
plt.xlabel(None)
plt.ylabel(None)
plt.tight_layout()
plt.axis("equal")
plt.show()
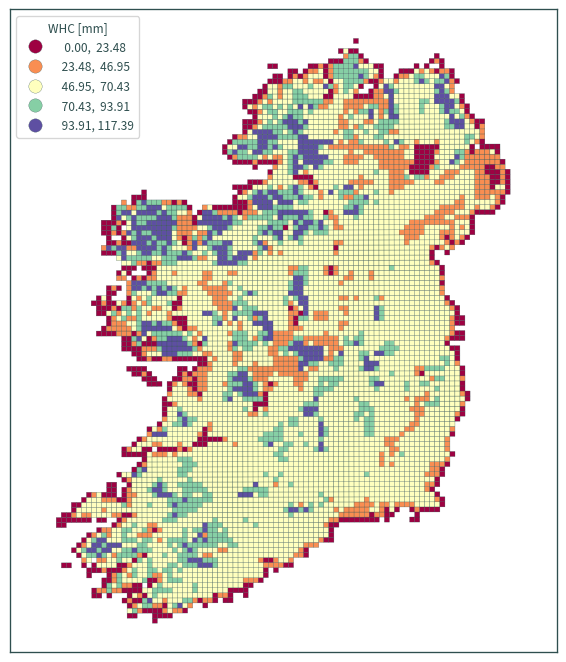
Zonal stats#
grid_cells = gpd.GeoDataFrame.from_features(
    zonal_stats(
        vectors=grid_cells.to_crs(data_crs),
        raster=os.path.join(DATA_DIR, "IE_TAWC.tif"),
        stats=["count", "mean"],
        geojson_out=True,
        nodata=-999999,
    ),
    crs=data_crs,
).to_crs(grid_cells.crs)
grid_cells.head()
| geometry | rlon | rlat | sr | ni | mean | count | |
|---|---|---|---|---|---|---|---|
| 0 | POLYGON ((417558.169 590305.234, 417549.771 59... | -1.680 | -1.315 | 0.917024 | 0.35 | 10.436507 | 15 |
| 1 | POLYGON ((417549.771 594200.519, 417541.440 59... | -1.680 | -1.280 | 0.917024 | 0.35 | 0.000000 | 15 |
| 2 | POLYGON ((421531.348 559152.004, 421522.478 56... | -1.645 | -1.595 | 0.763591 | 0.35 | 0.000000 | 15 |
| 3 | POLYGON ((421462.259 590312.894, 421453.924 59... | -1.645 | -1.315 | 0.917024 | 0.35 | 0.000000 | 15 |
| 4 | POLYGON ((421453.924 594208.111, 421445.655 59... | -1.645 | -1.280 | 0.917024 | 0.35 | 5.218254 | 15 |
grid_cells.shape
(6118, 7)
grid_cells["mean"].min()
0.0
grid_cells["mean"].max()
117.3861328125
grid_cells["count"].min()
14
grid_cells["count"].max()
17
grid_cells[grid_cells["count"] == 0]
| geometry | rlon | rlat | sr | ni | mean | count |
|---|
axs = grid_cells.plot(
    column="mean",
    cmap="Spectral",
    scheme="equal_interval",
    edgecolor="darkslategrey",
    linewidth=0.2,
    figsize=(6, 7),
    legend=True,
    legend_kwds={"loc": "upper left", "fmt": "{:.2f}", "title": "WHC [mm]"},
    missing_kwds={
        "color": "darkslategrey",
        "edgecolor": "darkslategrey",
        "label": "No data",
    },
)
for legend_handle in axs.get_legend().legend_handles:
    legend_handle.set_markeredgewidth(0.2)
    legend_handle.set_markeredgecolor("darkslategrey")
axs.tick_params(labelbottom=False, labelleft=False)
plt.axis("equal")
plt.tight_layout()
plt.show()
grid_cells["whc"] = grid_cells["mean"]
grid_cells.drop(columns=["mean", "count"], inplace=True)
grid_cells.head()
| geometry | rlon | rlat | sr | ni | whc | |
|---|---|---|---|---|---|---|
| 0 | POLYGON ((417558.169 590305.234, 417549.771 59... | -1.680 | -1.315 | 0.917024 | 0.35 | 10.436507 |
| 1 | POLYGON ((417549.771 594200.519, 417541.440 59... | -1.680 | -1.280 | 0.917024 | 0.35 | 0.000000 |
| 2 | POLYGON ((421531.348 559152.004, 421522.478 56... | -1.645 | -1.595 | 0.763591 | 0.35 | 0.000000 |
| 3 | POLYGON ((421462.259 590312.894, 421453.924 59... | -1.645 | -1.315 | 0.917024 | 0.35 | 0.000000 |
| 4 | POLYGON ((421453.924 594208.111, 421445.655 59... | -1.645 | -1.280 | 0.917024 | 0.35 | 5.218254 |
grid_cells.to_file(
    os.path.join("data", "ModVege", "params.gpkg"), layer="hiresireland"
)