ModVege#
Jouven, M., Carrère, P., and Baumont, R. (2006a). ‘Model predicting dynamics of biomass, structure and digestibility of herbage in managed permanent pastures. 1. Model description’, Grass and Forage Science, vol. 61, no. 2, pp. 112-124. DOI: 10.1111/j.1365-2494.2006.00515.x.
Jouven, M., Carrère, P., and Baumont, R. (2006b). ‘Model predicting dynamics of biomass, structure and digestibility of herbage in managed permanent pastures. 2. Model evaluation’, Grass and Forage Science, vol. 61, no. 2, pp. 125-133. DOI: 10.1111/j.1365-2494.2006.00517.x.
Agri4cast (2023). ‘ModVege’. Available at: https://code.europa.eu/agri4cast/modvege (Accessed: 28 August 2023).
import os
from datetime import datetime, timezone
import numpy as np
import pandas as pd
from climag.modvege_run import run_modvege
DATA_DIR = os.path.join("data", "ModVege")

# define the name of the input params file
PARAMS_FILE = os.path.join(DATA_DIR, "params.csv")
# define the name of the input time series file
TS_FILE = os.path.join("data", "met", "MetEireann", "valentia.csv")
Input time series#
ts = pd.read_csv(TS_FILE, parse_dates=["time"])
ts.sort_values(by=["time"], inplace=True)
ts = ts.reset_index().set_index("time")
ts.head()
| index | T | PAR | PET | PP | RG | |
|---|---|---|---|---|---|---|
| time | ||||||
| 2019-01-01 | 0 | 9.85 | 1.28656 | 0.3 | 0.0 | 2.72 |
| 2019-01-02 | 1 | 9.35 | 1.41427 | 0.5 | 0.1 | 2.99 |
| 2019-01-03 | 2 | 8.95 | 0.80883 | 0.8 | 0.9 | 1.71 |
| 2019-01-04 | 3 | 8.35 | 0.97911 | 1.0 | 0.0 | 2.07 |
| 2019-01-05 | 4 | 9.55 | 0.57706 | 0.9 | 0.0 | 1.22 |
ts.tail()
| index | T | PAR | PET | PP | RG | |
|---|---|---|---|---|---|---|
| time | ||||||
| 2021-12-27 | 1091 | 9.60 | 1.71699 | 0.3 | 0.9 | 3.63 |
| 2021-12-28 | 1092 | 9.65 | 0.70004 | 0.6 | 7.7 | 1.48 |
| 2021-12-29 | 1093 | 12.60 | 1.19669 | 0.5 | 9.9 | 2.53 |
| 2021-12-30 | 1094 | 12.70 | 0.30272 | 0.3 | 22.2 | 0.64 |
| 2021-12-31 | 1095 | 13.20 | 0.44462 | 0.7 | 2.0 | 0.94 |
for year in ts.index.year.unique():
    print("T", year, round(np.mean(ts.loc[str(year)]["T"]), 2))
    print("PP", year, round(np.mean(ts.loc[str(year)]["PP"]), 2))
    print(
        "grazing season length",
        round(
            29.3 * np.mean(ts.loc[str(year)]["T"])
            - 0.1 * np.sum(ts.loc[str(year)]["PP"])
            + 19.5
        ),
    )
T 2019 11.13
PP 2019 4.66
grazing season length 175
T 2020 11.0
PP 2020 5.3
grazing season length 148
T 2021 11.15
PP 2021 4.24
grazing season length 191
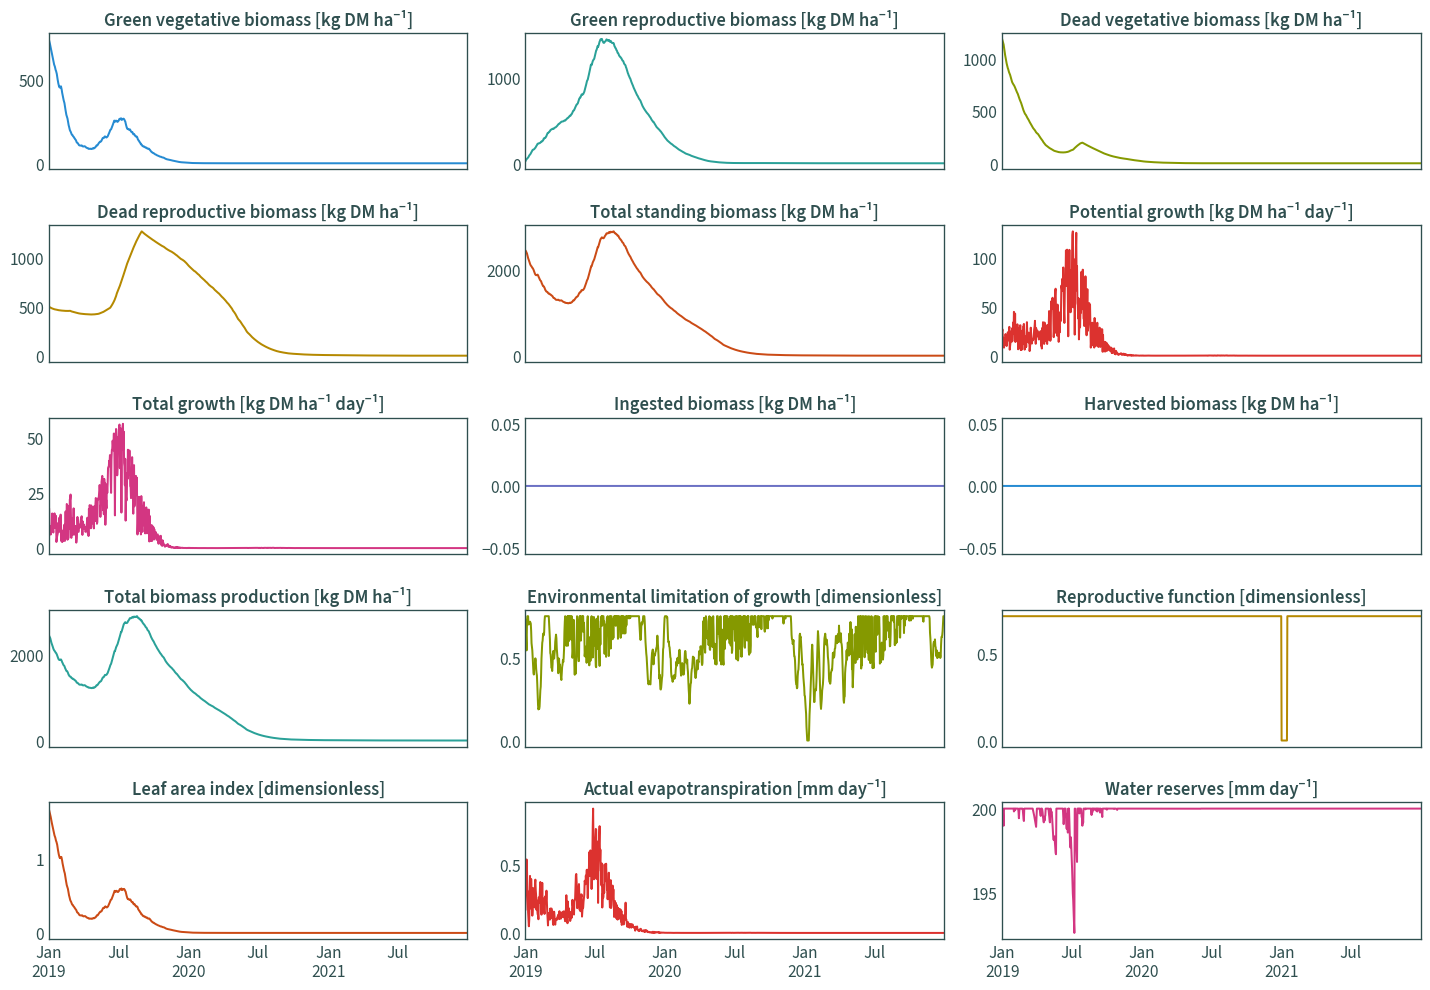
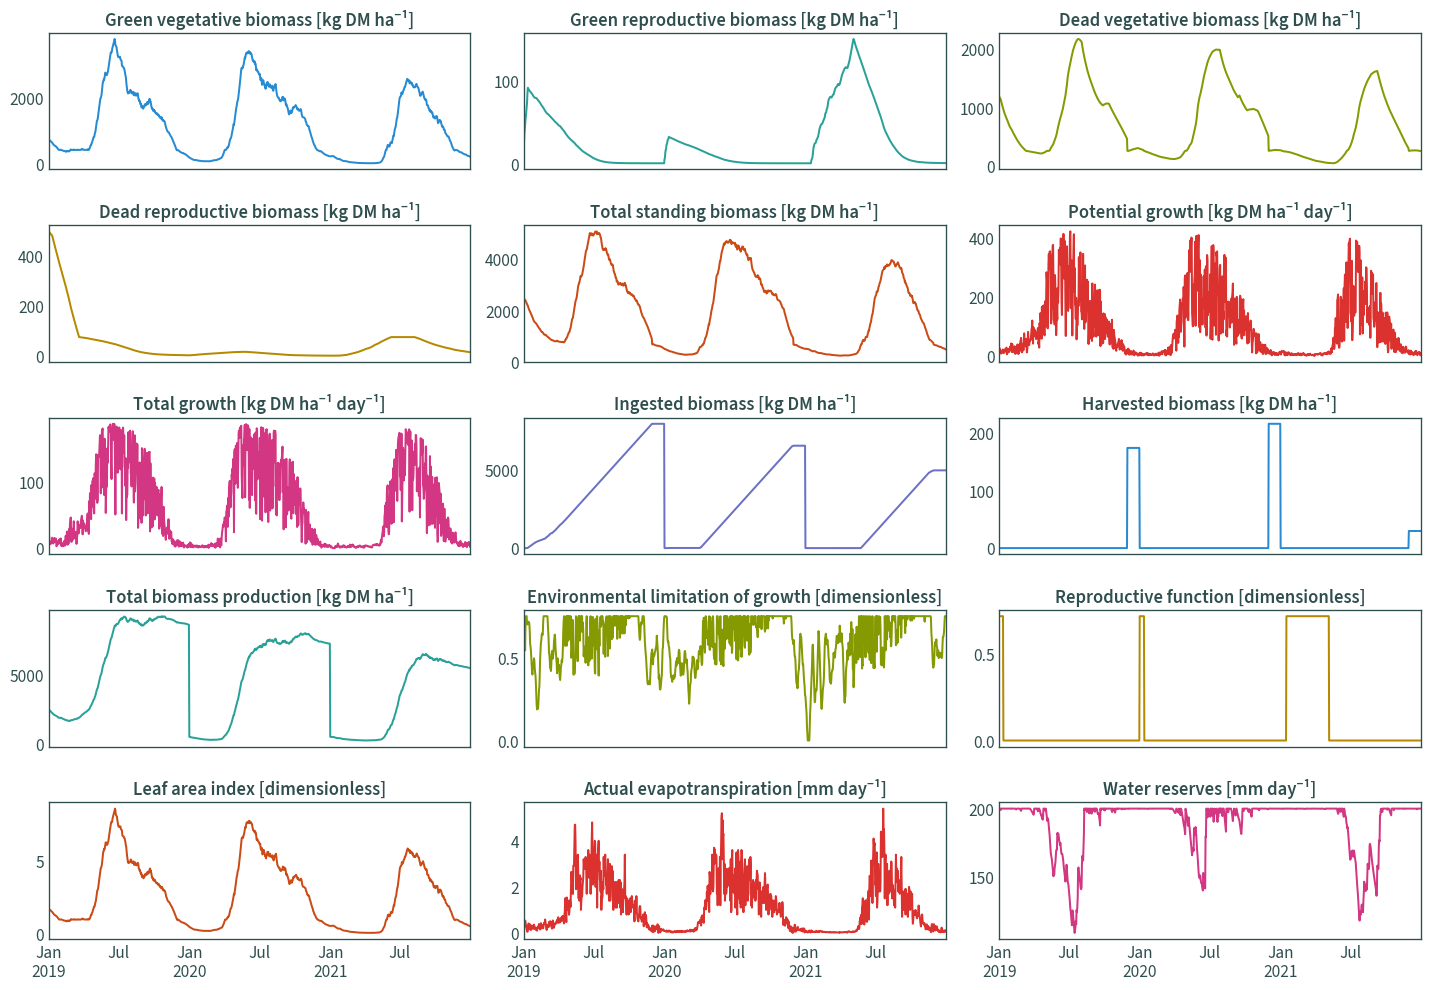
Results for different residual grass heights#
h = 0.05 m#
# run the main function using the example data
# rep = 0 when grazed/harvested
run_modvege(
    input_params_file=PARAMS_FILE,
    input_timeseries_file=TS_FILE,
    out_dir=DATA_DIR,
)
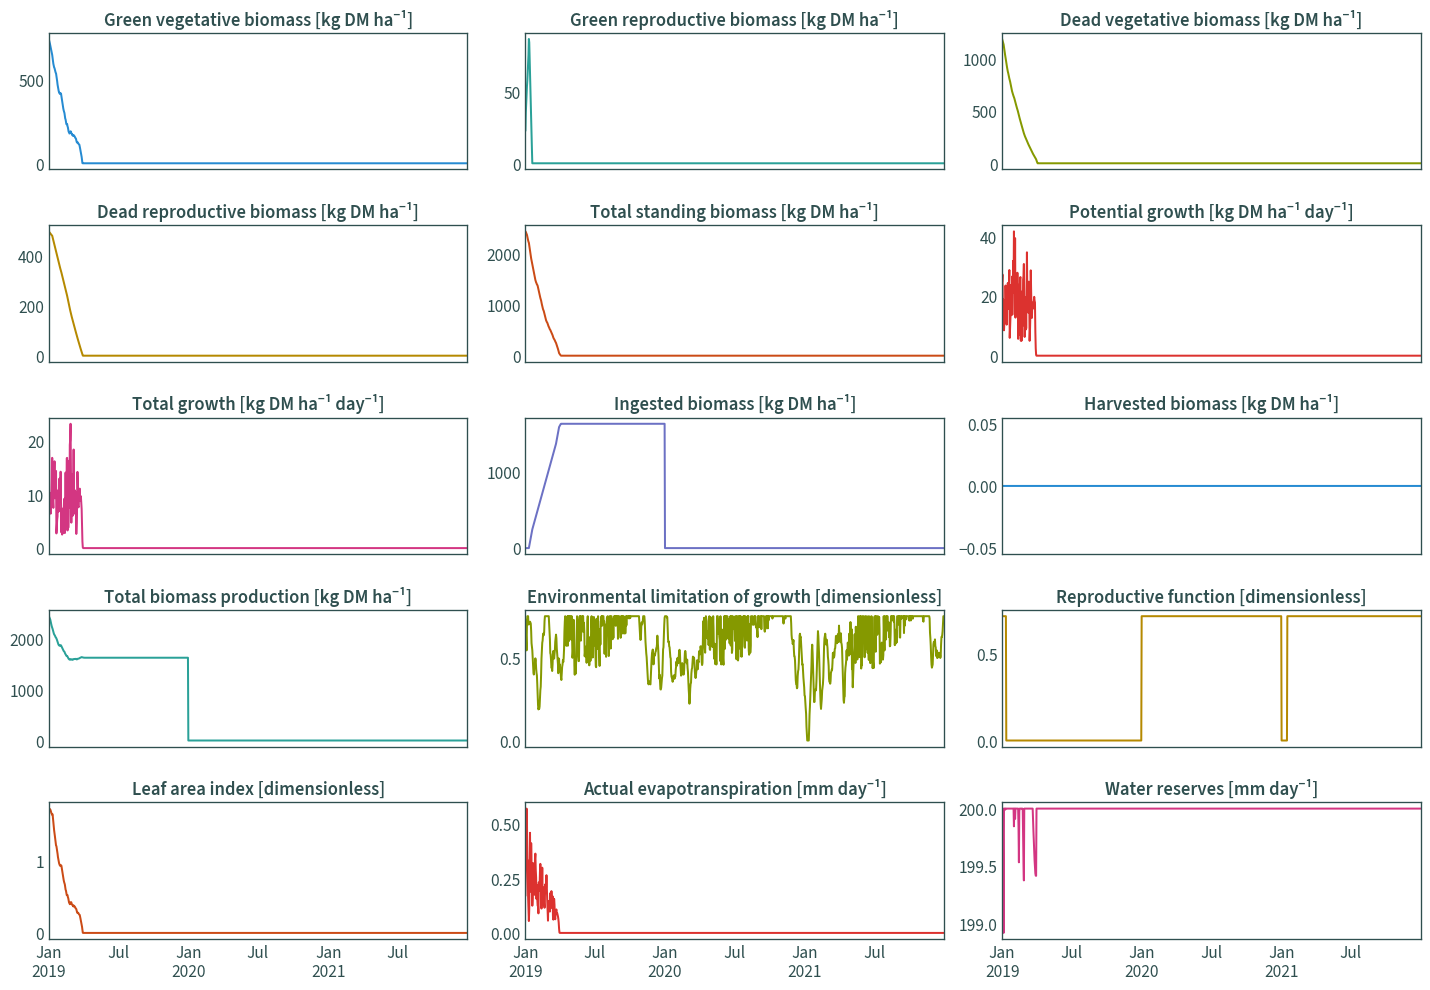
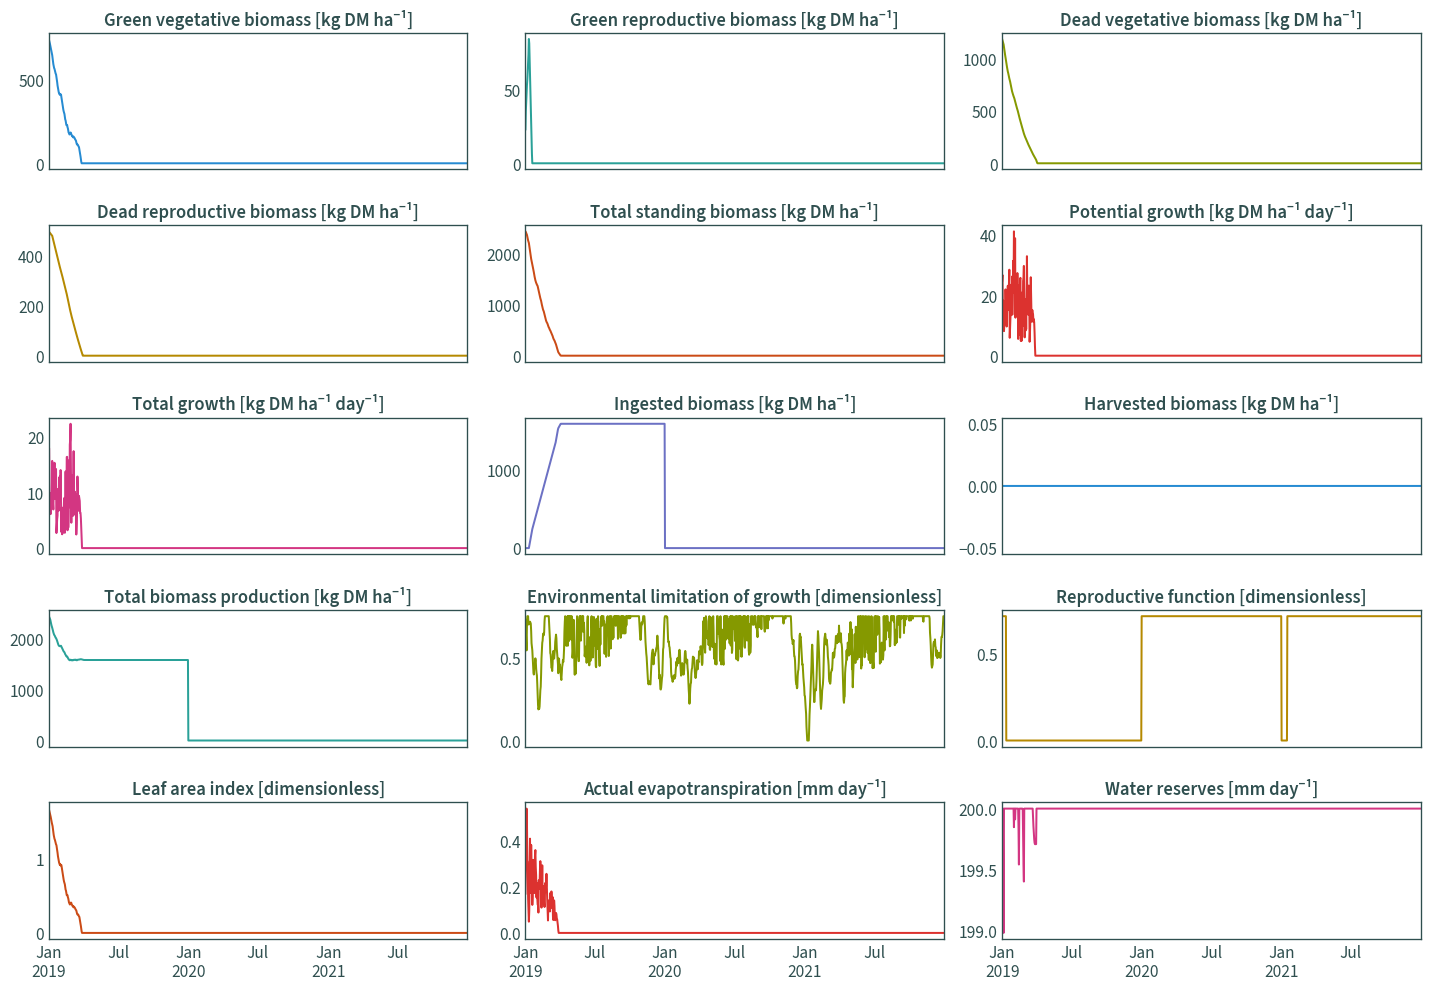
h = 0.00 m (max cutting)#
run_modvege(
    input_params_file=PARAMS_FILE,
    input_timeseries_file=TS_FILE,
    out_dir=DATA_DIR,
)
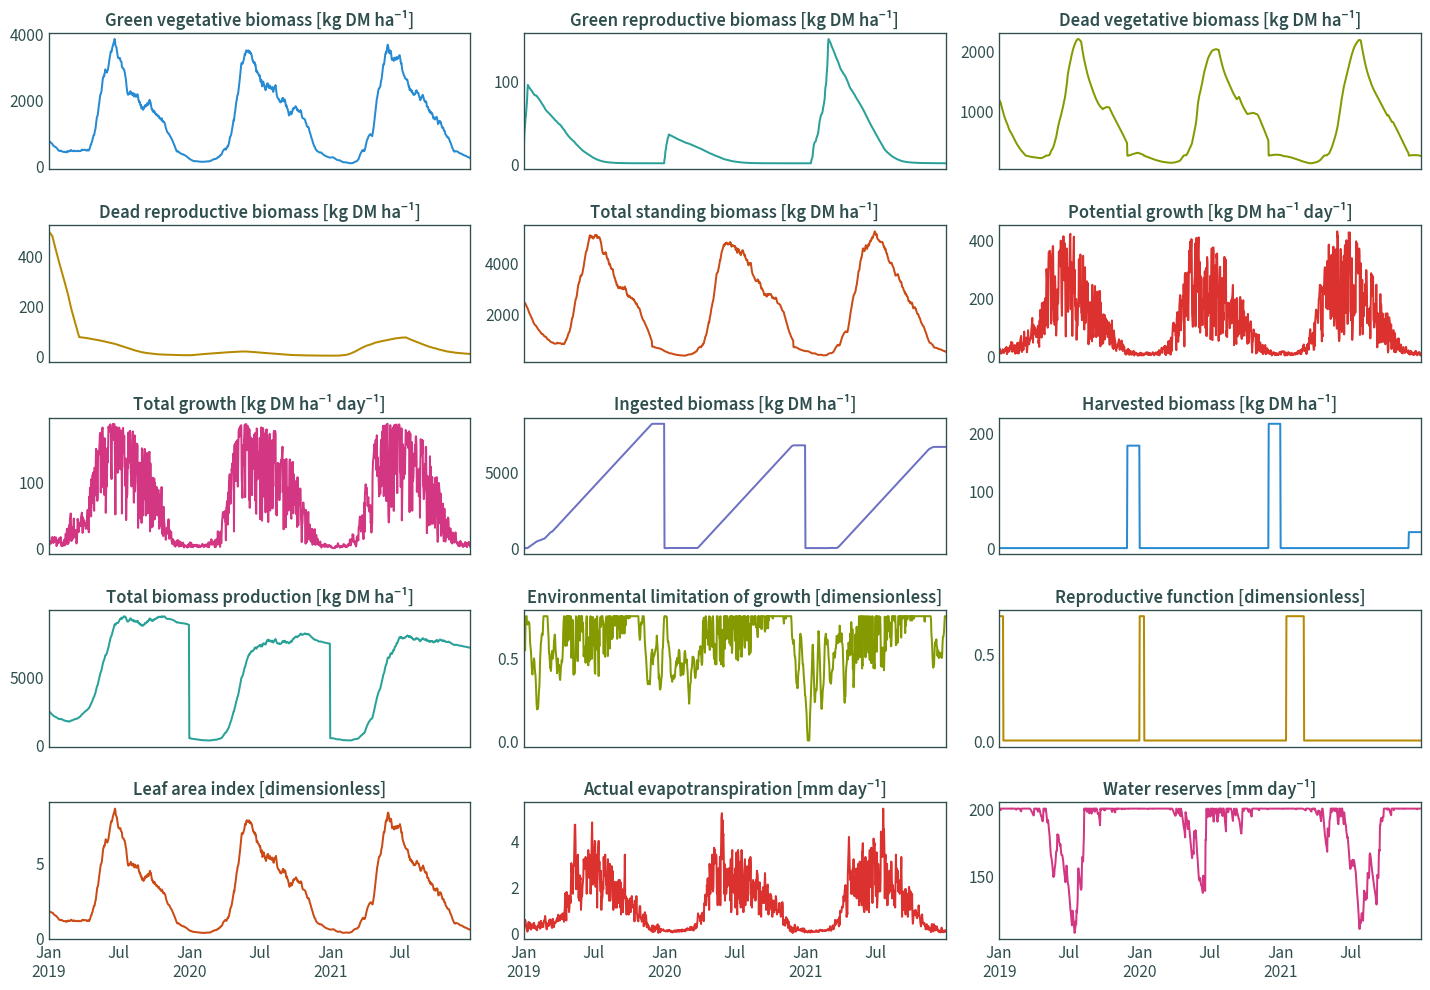
h = None (no cutting)#
run_modvege(
    input_params_file=PARAMS_FILE,
    input_timeseries_file=TS_FILE,
    out_dir=DATA_DIR,
)
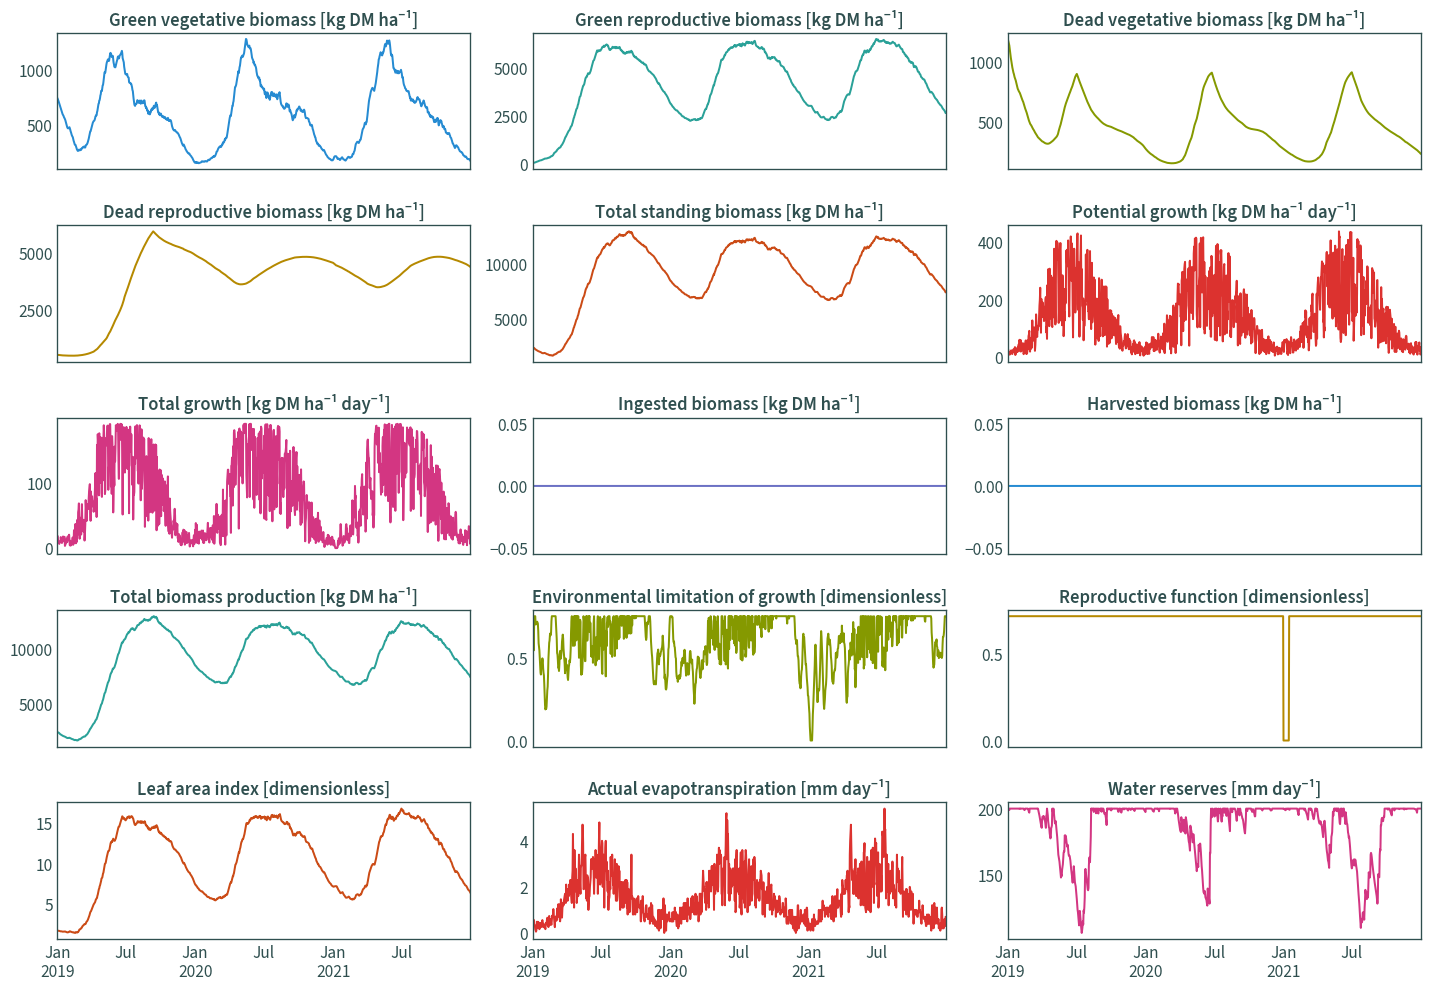
Using the original definition of LAI#
h = 0.05 m#
run_modvege(
    input_params_file=PARAMS_FILE,
    input_timeseries_file=TS_FILE,
    out_dir=DATA_DIR,
)
h = 0.00 m (max cutting)#
run_modvege(
    input_params_file=PARAMS_FILE,
    input_timeseries_file=TS_FILE,
    out_dir=DATA_DIR,
)
h = None (no cutting)#
run_modvege(
    input_params_file=PARAMS_FILE,
    input_timeseries_file=TS_FILE,
    out_dir=DATA_DIR,
)