Met Éireann Reanalysis - dealing with missing data#
import glob
import os
from datetime import datetime, timezone
import cartopy.crs as ccrs
import matplotlib.pyplot as plt
import pandas as pd
import xarray as xr
import climag.climag as cplt
# directory of processed MÉRA netCDF files
DATA_DIR = os.path.join("/run/media/nms/MyPassport", "MERA", "netcdf_day")
Find timestamps with missing data#
ds_grib = xr.open_dataset(
    "/run/media/nms/MyPassport/MERA/grib/117_105_0_4_FC3hr/"
    "MERA_PRODYEAR_2013_05_117_105_0_4_FC3hr",
    chunks="auto",
    decode_coords="all",
    engine="cfgrib",
)
ds_grib
<xarray.Dataset>
Dimensions:            (time: 128, step: 3, y: 489, x: 529)
Coordinates:
  * time               (time) datetime64[ns] 2013-05-01 ... 2013-05-16T21:00:00
  * step               (step) timedelta64[ns] 01:00:00 02:00:00 03:00:00
    heightAboveGround  float64 ...
    latitude           (y, x) float64 dask.array<chunksize=(489, 529), meta=np.ndarray>
    longitude          (y, x) float64 dask.array<chunksize=(489, 529), meta=np.ndarray>
    valid_time         (time, step) datetime64[ns] dask.array<chunksize=(128, 3), meta=np.ndarray>
Dimensions without coordinates: y, x
Data variables:
    grad               (time, step, y, x) float32 dask.array<chunksize=(101, 2, 390, 422), meta=np.ndarray>
Attributes:
    GRIB_edition:            1
    GRIB_centre:             eidb
    GRIB_centreDescription:  Dublin
    GRIB_subCentre:          255
    Conventions:             CF-1.7
    institution:             Dublin
    history:                 2023-04-18T15:55 GRIB to CDM+CF via cfgrib-0.9.1...
xarray.Dataset
- time: 128
- step: 3
- y: 489
- x: 529
- time(time)datetime64[ns]2013-05-01 ... 2013-05-16T21:00:00
- long_name :
- initial time of forecast
- standard_name :
- forecast_reference_time
array(['2013-05-01T00:00:00.000000000', '2013-05-01T03:00:00.000000000', '2013-05-01T06:00:00.000000000', '2013-05-01T09:00:00.000000000', '2013-05-01T12:00:00.000000000', '2013-05-01T15:00:00.000000000', '2013-05-01T18:00:00.000000000', '2013-05-01T21:00:00.000000000', '2013-05-02T00:00:00.000000000', '2013-05-02T03:00:00.000000000', '2013-05-02T06:00:00.000000000', '2013-05-02T09:00:00.000000000', '2013-05-02T12:00:00.000000000', '2013-05-02T15:00:00.000000000', '2013-05-02T18:00:00.000000000', '2013-05-02T21:00:00.000000000', '2013-05-03T00:00:00.000000000', '2013-05-03T03:00:00.000000000', '2013-05-03T06:00:00.000000000', '2013-05-03T09:00:00.000000000', '2013-05-03T12:00:00.000000000', '2013-05-03T15:00:00.000000000', '2013-05-03T18:00:00.000000000', '2013-05-03T21:00:00.000000000', '2013-05-04T00:00:00.000000000', '2013-05-04T03:00:00.000000000', '2013-05-04T06:00:00.000000000', '2013-05-04T09:00:00.000000000', '2013-05-04T12:00:00.000000000', '2013-05-04T15:00:00.000000000', '2013-05-04T18:00:00.000000000', '2013-05-04T21:00:00.000000000', '2013-05-05T00:00:00.000000000', '2013-05-05T03:00:00.000000000', '2013-05-05T06:00:00.000000000', '2013-05-05T09:00:00.000000000', '2013-05-05T12:00:00.000000000', '2013-05-05T15:00:00.000000000', '2013-05-05T18:00:00.000000000', '2013-05-05T21:00:00.000000000', '2013-05-06T00:00:00.000000000', '2013-05-06T03:00:00.000000000', '2013-05-06T06:00:00.000000000', '2013-05-06T09:00:00.000000000', '2013-05-06T12:00:00.000000000', '2013-05-06T15:00:00.000000000', '2013-05-06T18:00:00.000000000', '2013-05-06T21:00:00.000000000', '2013-05-07T00:00:00.000000000', '2013-05-07T03:00:00.000000000', '2013-05-07T06:00:00.000000000', '2013-05-07T09:00:00.000000000', '2013-05-07T12:00:00.000000000', '2013-05-07T15:00:00.000000000', '2013-05-07T18:00:00.000000000', '2013-05-07T21:00:00.000000000', '2013-05-08T00:00:00.000000000', '2013-05-08T03:00:00.000000000', '2013-05-08T06:00:00.000000000', '2013-05-08T09:00:00.000000000', '2013-05-08T12:00:00.000000000', '2013-05-08T15:00:00.000000000', '2013-05-08T18:00:00.000000000', '2013-05-08T21:00:00.000000000', '2013-05-09T00:00:00.000000000', '2013-05-09T03:00:00.000000000', '2013-05-09T06:00:00.000000000', '2013-05-09T09:00:00.000000000', '2013-05-09T12:00:00.000000000', '2013-05-09T15:00:00.000000000', '2013-05-09T18:00:00.000000000', '2013-05-09T21:00:00.000000000', '2013-05-10T00:00:00.000000000', '2013-05-10T03:00:00.000000000', '2013-05-10T06:00:00.000000000', '2013-05-10T09:00:00.000000000', '2013-05-10T12:00:00.000000000', '2013-05-10T15:00:00.000000000', '2013-05-10T18:00:00.000000000', '2013-05-10T21:00:00.000000000', '2013-05-11T00:00:00.000000000', '2013-05-11T03:00:00.000000000', '2013-05-11T06:00:00.000000000', '2013-05-11T09:00:00.000000000', '2013-05-11T12:00:00.000000000', '2013-05-11T15:00:00.000000000', '2013-05-11T18:00:00.000000000', '2013-05-11T21:00:00.000000000', '2013-05-12T00:00:00.000000000', '2013-05-12T03:00:00.000000000', '2013-05-12T06:00:00.000000000', '2013-05-12T09:00:00.000000000', '2013-05-12T12:00:00.000000000', '2013-05-12T15:00:00.000000000', '2013-05-12T18:00:00.000000000', '2013-05-12T21:00:00.000000000', '2013-05-13T00:00:00.000000000', '2013-05-13T03:00:00.000000000', '2013-05-13T06:00:00.000000000', '2013-05-13T09:00:00.000000000', '2013-05-13T12:00:00.000000000', '2013-05-13T15:00:00.000000000', '2013-05-13T18:00:00.000000000', '2013-05-13T21:00:00.000000000', '2013-05-14T00:00:00.000000000', '2013-05-14T03:00:00.000000000', '2013-05-14T06:00:00.000000000', '2013-05-14T09:00:00.000000000', '2013-05-14T12:00:00.000000000', '2013-05-14T15:00:00.000000000', '2013-05-14T18:00:00.000000000', '2013-05-14T21:00:00.000000000', '2013-05-15T00:00:00.000000000', '2013-05-15T03:00:00.000000000', '2013-05-15T06:00:00.000000000', '2013-05-15T09:00:00.000000000', '2013-05-15T12:00:00.000000000', '2013-05-15T15:00:00.000000000', '2013-05-15T18:00:00.000000000', '2013-05-15T21:00:00.000000000', '2013-05-16T00:00:00.000000000', '2013-05-16T03:00:00.000000000', '2013-05-16T06:00:00.000000000', '2013-05-16T09:00:00.000000000', '2013-05-16T12:00:00.000000000', '2013-05-16T15:00:00.000000000', '2013-05-16T18:00:00.000000000', '2013-05-16T21:00:00.000000000'], dtype='datetime64[ns]') - step(step)timedelta64[ns]01:00:00 02:00:00 03:00:00
- long_name :
- time since forecast_reference_time
- standard_name :
- forecast_period
array([ 3600000000000, 7200000000000, 10800000000000], dtype='timedelta64[ns]')
- heightAboveGround()float64...
- long_name :
- height above the surface
- units :
- m
- positive :
- up
- standard_name :
- height
[1 values with dtype=float64]
- latitude(y, x)float64dask.array<chunksize=(489, 529), meta=np.ndarray>
- units :
- degrees_north
- standard_name :
- latitude
- long_name :
- latitude
Array Chunk Bytes 1.97 MiB 1.97 MiB Shape (489, 529) (489, 529) Dask graph 1 chunks in 2 graph layers Data type float64 numpy.ndarray - longitude(y, x)float64dask.array<chunksize=(489, 529), meta=np.ndarray>
- units :
- degrees_east
- standard_name :
- longitude
- long_name :
- longitude
Array Chunk Bytes 1.97 MiB 1.97 MiB Shape (489, 529) (489, 529) Dask graph 1 chunks in 2 graph layers Data type float64 numpy.ndarray - valid_time(time, step)datetime64[ns]dask.array<chunksize=(128, 3), meta=np.ndarray>
- standard_name :
- time
- long_name :
- time
Array Chunk Bytes 3.00 kiB 3.00 kiB Shape (128, 3) (128, 3) Dask graph 1 chunks in 2 graph layers Data type datetime64[ns] numpy.ndarray
- grad(time, step, y, x)float32dask.array<chunksize=(101, 2, 390, 422), meta=np.ndarray>
- GRIB_paramId :
- 233253117
- GRIB_numberOfPoints :
- 258681
- GRIB_typeOfLevel :
- heightAboveGround
- GRIB_stepUnits :
- 1
- GRIB_stepType :
- accum
- GRIB_gridType :
- lambert
- GRIB_DxInMetres :
- 2500
- GRIB_DyInMetres :
- 2500
- GRIB_LaDInDegrees :
- 53.5
- GRIB_Latin1InDegrees :
- 53.5
- GRIB_Latin2InDegrees :
- 53.5
- GRIB_LoVInDegrees :
- 5.0
- GRIB_NV :
- 132
- GRIB_Nx :
- 529
- GRIB_Ny :
- 489
- GRIB_cfName :
- unknown
- GRIB_cfVarName :
- unknown
- GRIB_gridDefinitionDescription :
- Lambert Conformal
- GRIB_iScansNegatively :
- 0
- GRIB_jPointsAreConsecutive :
- 0
- GRIB_jScansPositively :
- 1
- GRIB_latitudeOfFirstGridPointInDegrees :
- 46.834
- GRIB_latitudeOfSouthernPoleInDegrees :
- 0.0
- GRIB_longitudeOfFirstGridPointInDegrees :
- -14.609
- GRIB_longitudeOfSouthernPoleInDegrees :
- 0.0
- GRIB_missingValue :
- 3.4028234663852886e+38
- GRIB_name :
- Global radiation flux
- GRIB_shortName :
- grad
- GRIB_units :
- W m**-2
- long_name :
- Global radiation flux
- units :
- W m**-2
- standard_name :
- unknown
Array Chunk Bytes 378.93 MiB 126.82 MiB Shape (128, 3, 489, 529) (101, 2, 390, 422) Dask graph 16 chunks in 2 graph layers Data type float32 numpy.ndarray
- timePandasIndex
PandasIndex(DatetimeIndex(['2013-05-01 00:00:00', '2013-05-01 03:00:00', '2013-05-01 06:00:00', '2013-05-01 09:00:00', '2013-05-01 12:00:00', '2013-05-01 15:00:00', '2013-05-01 18:00:00', '2013-05-01 21:00:00', '2013-05-02 00:00:00', '2013-05-02 03:00:00', ... '2013-05-15 18:00:00', '2013-05-15 21:00:00', '2013-05-16 00:00:00', '2013-05-16 03:00:00', '2013-05-16 06:00:00', '2013-05-16 09:00:00', '2013-05-16 12:00:00', '2013-05-16 15:00:00', '2013-05-16 18:00:00', '2013-05-16 21:00:00'], dtype='datetime64[ns]', name='time', length=128, freq=None)) - stepPandasIndex
PandasIndex(TimedeltaIndex(['0 days 01:00:00', '0 days 02:00:00', '0 days 03:00:00'], dtype='timedelta64[ns]', name='step', freq=None))
- GRIB_edition :
- 1
- GRIB_centre :
- eidb
- GRIB_centreDescription :
- Dublin
- GRIB_subCentre :
- 255
- Conventions :
- CF-1.7
- institution :
- Dublin
- history :
- 2023-04-18T15:55 GRIB to CDM+CF via cfgrib-0.9.10.3/ecCodes-2.28.0 with {"source": "../../../../../MyPassport/MERA/grib/117_105_0_4_FC3hr/MERA_PRODYEAR_2013_05_117_105_0_4_FC3hr", "filter_by_keys": {}, "encode_cf": ["parameter", "time", "geography", "vertical"]}
ds_nc = xr.open_dataset(
    "/run/media/nms/MyPassport/MERA/netcdf/117_105_0_4_FC3hr/"
    "MERA_PRODYEAR_2013_05_117_105_0_4_FC3hr.nc",
    chunks="auto",
    decode_coords="all",
)
ds_nc
<xarray.Dataset>
Dimensions:            (time: 128, x: 158, y: 166, height: 1)
Coordinates:
  * time               (time) datetime64[ns] 2013-05-01 ... 2013-05-16T21:00:00
  * x                  (x) float64 4.15e+05 4.175e+05 ... 8.05e+05 8.075e+05
  * y                  (y) float64 4.075e+05 4.1e+05 ... 8.175e+05 8.2e+05
  * height             (height) float64 0.0
    spatial_ref        int64 ...
    Lambert_Conformal  int64 ...
Data variables:
    grad               (time, height, y, x) float32 dask.array<chunksize=(128, 1, 166, 158), meta=np.ndarray>
Attributes:
    CDI:          Climate Data Interface version 2.0.5 (https://mpimet.mpg.de...
    Conventions:  CF-1.6
    history:      Sat Apr 15 21:05:39 2023: cdo -s -f nc4c -shifttime,-3hour ...
    CDO:          Climate Data Operators version 2.0.5 (https://mpimet.mpg.de...
xarray.Dataset
- time: 128
- x: 158
- y: 166
- height: 1
- time(time)datetime64[ns]2013-05-01 ... 2013-05-16T21:00:00
- standard_name :
- time
- axis :
- T
array(['2013-05-01T00:00:00.000000000', '2013-05-01T03:00:00.000000000', '2013-05-01T06:00:00.000000000', '2013-05-01T09:00:00.000000000', '2013-05-01T12:00:00.000000000', '2013-05-01T15:00:00.000000000', '2013-05-01T18:00:00.000000000', '2013-05-01T21:00:00.000000000', '2013-05-02T00:00:00.000000000', '2013-05-02T03:00:00.000000000', '2013-05-02T06:00:00.000000000', '2013-05-02T09:00:00.000000000', '2013-05-02T12:00:00.000000000', '2013-05-02T15:00:00.000000000', '2013-05-02T18:00:00.000000000', '2013-05-02T21:00:00.000000000', '2013-05-03T00:00:00.000000000', '2013-05-03T03:00:00.000000000', '2013-05-03T06:00:00.000000000', '2013-05-03T09:00:00.000000000', '2013-05-03T12:00:00.000000000', '2013-05-03T15:00:00.000000000', '2013-05-03T18:00:00.000000000', '2013-05-03T21:00:00.000000000', '2013-05-04T00:00:00.000000000', '2013-05-04T03:00:00.000000000', '2013-05-04T06:00:00.000000000', '2013-05-04T09:00:00.000000000', '2013-05-04T12:00:00.000000000', '2013-05-04T15:00:00.000000000', '2013-05-04T18:00:00.000000000', '2013-05-04T21:00:00.000000000', '2013-05-05T00:00:00.000000000', '2013-05-05T03:00:00.000000000', '2013-05-05T06:00:00.000000000', '2013-05-05T09:00:00.000000000', '2013-05-05T12:00:00.000000000', '2013-05-05T15:00:00.000000000', '2013-05-05T18:00:00.000000000', '2013-05-05T21:00:00.000000000', '2013-05-06T00:00:00.000000000', '2013-05-06T03:00:00.000000000', '2013-05-06T06:00:00.000000000', '2013-05-06T09:00:00.000000000', '2013-05-06T12:00:00.000000000', '2013-05-06T15:00:00.000000000', '2013-05-06T18:00:00.000000000', '2013-05-06T21:00:00.000000000', '2013-05-07T00:00:00.000000000', '2013-05-07T03:00:00.000000000', '2013-05-07T06:00:00.000000000', '2013-05-07T09:00:00.000000000', '2013-05-07T12:00:00.000000000', '2013-05-07T15:00:00.000000000', '2013-05-07T18:00:00.000000000', '2013-05-07T21:00:00.000000000', '2013-05-08T00:00:00.000000000', '2013-05-08T03:00:00.000000000', '2013-05-08T06:00:00.000000000', '2013-05-08T09:00:00.000000000', '2013-05-08T12:00:00.000000000', '2013-05-08T15:00:00.000000000', '2013-05-08T18:00:00.000000000', '2013-05-08T21:00:00.000000000', '2013-05-09T00:00:00.000000000', '2013-05-09T03:00:00.000000000', '2013-05-09T06:00:00.000000000', '2013-05-09T09:00:00.000000000', '2013-05-09T12:00:00.000000000', '2013-05-09T15:00:00.000000000', '2013-05-09T18:00:00.000000000', '2013-05-09T21:00:00.000000000', '2013-05-10T00:00:00.000000000', '2013-05-10T03:00:00.000000000', '2013-05-10T06:00:00.000000000', '2013-05-10T09:00:00.000000000', '2013-05-10T12:00:00.000000000', '2013-05-10T15:00:00.000000000', '2013-05-10T18:00:00.000000000', '2013-05-10T21:00:00.000000000', '2013-05-11T00:00:00.000000000', '2013-05-11T03:00:00.000000000', '2013-05-11T06:00:00.000000000', '2013-05-11T09:00:00.000000000', '2013-05-11T12:00:00.000000000', '2013-05-11T15:00:00.000000000', '2013-05-11T18:00:00.000000000', '2013-05-11T21:00:00.000000000', '2013-05-12T00:00:00.000000000', '2013-05-12T03:00:00.000000000', '2013-05-12T06:00:00.000000000', '2013-05-12T09:00:00.000000000', '2013-05-12T12:00:00.000000000', '2013-05-12T15:00:00.000000000', '2013-05-12T18:00:00.000000000', '2013-05-12T21:00:00.000000000', '2013-05-13T00:00:00.000000000', '2013-05-13T03:00:00.000000000', '2013-05-13T06:00:00.000000000', '2013-05-13T09:00:00.000000000', '2013-05-13T12:00:00.000000000', '2013-05-13T15:00:00.000000000', '2013-05-13T18:00:00.000000000', '2013-05-13T21:00:00.000000000', '2013-05-14T00:00:00.000000000', '2013-05-14T03:00:00.000000000', '2013-05-14T06:00:00.000000000', '2013-05-14T09:00:00.000000000', '2013-05-14T12:00:00.000000000', '2013-05-14T15:00:00.000000000', '2013-05-14T18:00:00.000000000', '2013-05-14T21:00:00.000000000', '2013-05-15T00:00:00.000000000', '2013-05-15T03:00:00.000000000', '2013-05-15T06:00:00.000000000', '2013-05-15T09:00:00.000000000', '2013-05-15T12:00:00.000000000', '2013-05-15T15:00:00.000000000', '2013-05-15T18:00:00.000000000', '2013-05-15T21:00:00.000000000', '2013-05-16T00:00:00.000000000', '2013-05-16T03:00:00.000000000', '2013-05-16T06:00:00.000000000', '2013-05-16T09:00:00.000000000', '2013-05-16T12:00:00.000000000', '2013-05-16T15:00:00.000000000', '2013-05-16T18:00:00.000000000', '2013-05-16T21:00:00.000000000'], dtype='datetime64[ns]') - x(x)float644.15e+05 4.175e+05 ... 8.075e+05
- standard_name :
- projection_x_coordinate
- units :
- metre
- axis :
- X
- long_name :
- x coordinate of projection
array([415000., 417500., 420000., 422500., 425000., 427500., 430000., 432500., 435000., 437500., 440000., 442500., 445000., 447500., 450000., 452500., 455000., 457500., 460000., 462500., 465000., 467500., 470000., 472500., 475000., 477500., 480000., 482500., 485000., 487500., 490000., 492500., 495000., 497500., 500000., 502500., 505000., 507500., 510000., 512500., 515000., 517500., 520000., 522500., 525000., 527500., 530000., 532500., 535000., 537500., 540000., 542500., 545000., 547500., 550000., 552500., 555000., 557500., 560000., 562500., 565000., 567500., 570000., 572500., 575000., 577500., 580000., 582500., 585000., 587500., 590000., 592500., 595000., 597500., 600000., 602500., 605000., 607500., 610000., 612500., 615000., 617500., 620000., 622500., 625000., 627500., 630000., 632500., 635000., 637500., 640000., 642500., 645000., 647500., 650000., 652500., 655000., 657500., 660000., 662500., 665000., 667500., 670000., 672500., 675000., 677500., 680000., 682500., 685000., 687500., 690000., 692500., 695000., 697500., 700000., 702500., 705000., 707500., 710000., 712500., 715000., 717500., 720000., 722500., 725000., 727500., 730000., 732500., 735000., 737500., 740000., 742500., 745000., 747500., 750000., 752500., 755000., 757500., 760000., 762500., 765000., 767500., 770000., 772500., 775000., 777500., 780000., 782500., 785000., 787500., 790000., 792500., 795000., 797500., 800000., 802500., 805000., 807500.]) - y(y)float644.075e+05 4.1e+05 ... 8.2e+05
- standard_name :
- projection_y_coordinate
- units :
- metre
- axis :
- Y
- long_name :
- y coordinate of projection
array([407500., 410000., 412500., 415000., 417500., 420000., 422500., 425000., 427500., 430000., 432500., 435000., 437500., 440000., 442500., 445000., 447500., 450000., 452500., 455000., 457500., 460000., 462500., 465000., 467500., 470000., 472500., 475000., 477500., 480000., 482500., 485000., 487500., 490000., 492500., 495000., 497500., 500000., 502500., 505000., 507500., 510000., 512500., 515000., 517500., 520000., 522500., 525000., 527500., 530000., 532500., 535000., 537500., 540000., 542500., 545000., 547500., 550000., 552500., 555000., 557500., 560000., 562500., 565000., 567500., 570000., 572500., 575000., 577500., 580000., 582500., 585000., 587500., 590000., 592500., 595000., 597500., 600000., 602500., 605000., 607500., 610000., 612500., 615000., 617500., 620000., 622500., 625000., 627500., 630000., 632500., 635000., 637500., 640000., 642500., 645000., 647500., 650000., 652500., 655000., 657500., 660000., 662500., 665000., 667500., 670000., 672500., 675000., 677500., 680000., 682500., 685000., 687500., 690000., 692500., 695000., 697500., 700000., 702500., 705000., 707500., 710000., 712500., 715000., 717500., 720000., 722500., 725000., 727500., 730000., 732500., 735000., 737500., 740000., 742500., 745000., 747500., 750000., 752500., 755000., 757500., 760000., 762500., 765000., 767500., 770000., 772500., 775000., 777500., 780000., 782500., 785000., 787500., 790000., 792500., 795000., 797500., 800000., 802500., 805000., 807500., 810000., 812500., 815000., 817500., 820000.]) - height(height)float640.0
- standard_name :
- height
- long_name :
- height
- units :
- m
- positive :
- up
- axis :
- Z
array([0.])
- spatial_ref()int64...
- GeoTransform :
- 413750.0 2500.0 0.0 406250.0 0.0 2500.0
[1 values with dtype=int64]
- Lambert_Conformal()int64...
- crs_wkt :
- PROJCS["undefined",GEOGCS["undefined",DATUM["undefined",SPHEROID["undefined",6367470,0]],PRIMEM["Greenwich",0,AUTHORITY["EPSG","8901"]],UNIT["degree",0.0174532925199433]],PROJECTION["Lambert_Conformal_Conic_1SP"],PARAMETER["latitude_of_origin",53.5],PARAMETER["central_meridian",5],PARAMETER["scale_factor",1],PARAMETER["false_easting",1481641.67696368],PARAMETER["false_northing",537326.063885016],UNIT["metre",1,AUTHORITY["EPSG","9001"]],AXIS["Easting",EAST],AXIS["Northing",NORTH]]
- semi_major_axis :
- 6367470.0
- semi_minor_axis :
- 6367470.0
- inverse_flattening :
- 0.0
- reference_ellipsoid_name :
- undefined
- longitude_of_prime_meridian :
- 0.0
- prime_meridian_name :
- Greenwich
- geographic_crs_name :
- undefined
- horizontal_datum_name :
- undefined
- projected_crs_name :
- undefined
- grid_mapping_name :
- lambert_conformal_conic
- standard_parallel :
- 53.5
- longitude_of_central_meridian :
- 5.0
- false_easting :
- 1481641.67696368
- false_northing :
- 537326.063885016
- spatial_ref :
- PROJCS["undefined",GEOGCS["undefined",DATUM["undefined",SPHEROID["undefined",6367470,0]],PRIMEM["Greenwich",0,AUTHORITY["EPSG","8901"]],UNIT["degree",0.0174532925199433]],PROJECTION["Lambert_Conformal_Conic_1SP"],PARAMETER["latitude_of_origin",53.5],PARAMETER["central_meridian",5],PARAMETER["scale_factor",1],PARAMETER["false_easting",1481641.67696368],PARAMETER["false_northing",537326.063885016],UNIT["metre",1,AUTHORITY["EPSG","9001"]],AXIS["Easting",EAST],AXIS["Northing",NORTH]]
- GeoTransform :
- 413750.0 2500.0 0.0 406250.0 0.0 2500.0
[1 values with dtype=int64]
- grad(time, height, y, x)float32dask.array<chunksize=(128, 1, 166, 158), meta=np.ndarray>
- GRIB_paramId :
- 233253117
- GRIB_numberOfPoints :
- 258681
- GRIB_typeOfLevel :
- heightAboveGround
- GRIB_stepUnits :
- 1
- GRIB_stepType :
- accum
- GRIB_gridType :
- lambert
- GRIB_DxInMetres :
- 2500
- GRIB_DyInMetres :
- 2500
- GRIB_LaDInDegrees :
- 53.5
- GRIB_Latin1InDegrees :
- 53.5
- GRIB_Latin2InDegrees :
- 53.5
- GRIB_LoVInDegrees :
- 5.0
- GRIB_NV :
- 132
- GRIB_Nx :
- 529
- GRIB_Ny :
- 489
- GRIB_cfName :
- unknown
- GRIB_cfVarName :
- unknown
- GRIB_gridDefinitionDescription :
- Lambert Conformal
- GRIB_iScansNegatively :
- 0
- GRIB_jPointsAreConsecutive :
- 0
- GRIB_jScansPositively :
- 1
- GRIB_latitudeOfFirstGridPointInDegrees :
- 46.834
- GRIB_latitudeOfSouthernPoleInDegrees :
- 0.0
- GRIB_longitudeOfFirstGridPointInDegrees :
- -14.609
- GRIB_longitudeOfSouthernPoleInDegrees :
- 0.0
- GRIB_missingValue :
- 3.4028234663852886e+38
- GRIB_name :
- Global radiation flux
- GRIB_shortName :
- grad
- GRIB_units :
- W m**-2
- long_name :
- Global radiation flux
- units :
- W m**-2
- standard_name :
- unknown
Array Chunk Bytes 12.81 MiB 12.81 MiB Shape (128, 1, 166, 158) (128, 1, 166, 158) Dask graph 1 chunks in 2 graph layers Data type float32 numpy.ndarray
- timePandasIndex
PandasIndex(DatetimeIndex(['2013-05-01 00:00:00', '2013-05-01 03:00:00', '2013-05-01 06:00:00', '2013-05-01 09:00:00', '2013-05-01 12:00:00', '2013-05-01 15:00:00', '2013-05-01 18:00:00', '2013-05-01 21:00:00', '2013-05-02 00:00:00', '2013-05-02 03:00:00', ... '2013-05-15 18:00:00', '2013-05-15 21:00:00', '2013-05-16 00:00:00', '2013-05-16 03:00:00', '2013-05-16 06:00:00', '2013-05-16 09:00:00', '2013-05-16 12:00:00', '2013-05-16 15:00:00', '2013-05-16 18:00:00', '2013-05-16 21:00:00'], dtype='datetime64[ns]', name='time', length=128, freq=None)) - xPandasIndex
PandasIndex(Float64Index([415000.0, 417500.0, 420000.0, 422500.0, 425000.0, 427500.0, 430000.0, 432500.0, 435000.0, 437500.0, ... 785000.0, 787500.0, 790000.0, 792500.0, 795000.0, 797500.0, 800000.0, 802500.0, 805000.0, 807500.0], dtype='float64', name='x', length=158)) - yPandasIndex
PandasIndex(Float64Index([407500.0, 410000.0, 412500.0, 415000.0, 417500.0, 420000.0, 422500.0, 425000.0, 427500.0, 430000.0, ... 797500.0, 800000.0, 802500.0, 805000.0, 807500.0, 810000.0, 812500.0, 815000.0, 817500.0, 820000.0], dtype='float64', name='y', length=166)) - heightPandasIndex
PandasIndex(Float64Index([0.0], dtype='float64', name='height'))
- CDI :
- Climate Data Interface version 2.0.5 (https://mpimet.mpg.de/cdi)
- Conventions :
- CF-1.6
- history :
- Sat Apr 15 21:05:39 2023: cdo -s -f nc4c -shifttime,-3hour -copy -seltimestep,3/384/3 /run/media/nms/MyPassport/MERA/grib/117_105_0_4_FC3hr/temp/MERA_PRODYEAR_2013_05_117_105_0_4_FC3hr /run/media/nms/MyPassport/MERA/grib/117_105_0_4_FC3hr/temp/MERA_PRODYEAR_2013_05_117_105_0_4_FC3hr.nc
- CDO :
- Climate Data Operators version 2.0.5 (https://mpimet.mpg.de/cdo)
Read radiation daily data#
ds = xr.open_dataset(
    os.path.join(DATA_DIR, "MERA_117_105_0_4_day.nc"),
    chunks="auto",
    decode_coords="all",
)
ds = ds.isel(height=0)
ds2 = xr.open_dataset(
    os.path.join(DATA_DIR, "MERA_111_105_0_4_day.nc"),
    chunks="auto",
    decode_coords="all",
)
ds2 = ds2.isel(height=0)
ds
<xarray.Dataset>
Dimensions:            (x: 158, y: 166, time: 2800)
Coordinates:
  * x                  (x) float64 4.15e+05 4.175e+05 ... 8.05e+05 8.075e+05
  * y                  (y) float64 4.075e+05 4.1e+05 ... 8.175e+05 8.2e+05
    height             float64 0.0
  * time               (time) datetime64[ns] 2012-01-01 ... 2019-08-31
    Lambert_Conformal  int64 ...
    spatial_ref        int64 ...
Data variables:
    grad               (time, y, x) float32 dask.array<chunksize=(2181, 127, 121), meta=np.ndarray>
Attributes:
    CDI:          Climate Data Interface version 2.0.5 (https://mpimet.mpg.de...
    Conventions:  CF-1.6
    history:      Sat Apr 15 21:01:13 2023: cdo -s -f nc4c -shifttime,-3hour ...
    CDO:          Climate Data Operators version 2.0.5 (https://mpimet.mpg.de...
xarray.Dataset
- x: 158
- y: 166
- time: 2800
- x(x)float644.15e+05 4.175e+05 ... 8.075e+05
- standard_name :
- projection_x_coordinate
- units :
- metre
- axis :
- X
- long_name :
- x coordinate of projection
array([415000., 417500., 420000., 422500., 425000., 427500., 430000., 432500., 435000., 437500., 440000., 442500., 445000., 447500., 450000., 452500., 455000., 457500., 460000., 462500., 465000., 467500., 470000., 472500., 475000., 477500., 480000., 482500., 485000., 487500., 490000., 492500., 495000., 497500., 500000., 502500., 505000., 507500., 510000., 512500., 515000., 517500., 520000., 522500., 525000., 527500., 530000., 532500., 535000., 537500., 540000., 542500., 545000., 547500., 550000., 552500., 555000., 557500., 560000., 562500., 565000., 567500., 570000., 572500., 575000., 577500., 580000., 582500., 585000., 587500., 590000., 592500., 595000., 597500., 600000., 602500., 605000., 607500., 610000., 612500., 615000., 617500., 620000., 622500., 625000., 627500., 630000., 632500., 635000., 637500., 640000., 642500., 645000., 647500., 650000., 652500., 655000., 657500., 660000., 662500., 665000., 667500., 670000., 672500., 675000., 677500., 680000., 682500., 685000., 687500., 690000., 692500., 695000., 697500., 700000., 702500., 705000., 707500., 710000., 712500., 715000., 717500., 720000., 722500., 725000., 727500., 730000., 732500., 735000., 737500., 740000., 742500., 745000., 747500., 750000., 752500., 755000., 757500., 760000., 762500., 765000., 767500., 770000., 772500., 775000., 777500., 780000., 782500., 785000., 787500., 790000., 792500., 795000., 797500., 800000., 802500., 805000., 807500.]) - y(y)float644.075e+05 4.1e+05 ... 8.2e+05
- standard_name :
- projection_y_coordinate
- units :
- metre
- axis :
- Y
- long_name :
- y coordinate of projection
array([407500., 410000., 412500., 415000., 417500., 420000., 422500., 425000., 427500., 430000., 432500., 435000., 437500., 440000., 442500., 445000., 447500., 450000., 452500., 455000., 457500., 460000., 462500., 465000., 467500., 470000., 472500., 475000., 477500., 480000., 482500., 485000., 487500., 490000., 492500., 495000., 497500., 500000., 502500., 505000., 507500., 510000., 512500., 515000., 517500., 520000., 522500., 525000., 527500., 530000., 532500., 535000., 537500., 540000., 542500., 545000., 547500., 550000., 552500., 555000., 557500., 560000., 562500., 565000., 567500., 570000., 572500., 575000., 577500., 580000., 582500., 585000., 587500., 590000., 592500., 595000., 597500., 600000., 602500., 605000., 607500., 610000., 612500., 615000., 617500., 620000., 622500., 625000., 627500., 630000., 632500., 635000., 637500., 640000., 642500., 645000., 647500., 650000., 652500., 655000., 657500., 660000., 662500., 665000., 667500., 670000., 672500., 675000., 677500., 680000., 682500., 685000., 687500., 690000., 692500., 695000., 697500., 700000., 702500., 705000., 707500., 710000., 712500., 715000., 717500., 720000., 722500., 725000., 727500., 730000., 732500., 735000., 737500., 740000., 742500., 745000., 747500., 750000., 752500., 755000., 757500., 760000., 762500., 765000., 767500., 770000., 772500., 775000., 777500., 780000., 782500., 785000., 787500., 790000., 792500., 795000., 797500., 800000., 802500., 805000., 807500., 810000., 812500., 815000., 817500., 820000.]) - height()float640.0
- standard_name :
- height
- long_name :
- height
- units :
- m
- positive :
- up
- axis :
- Z
array(0.)
- time(time)datetime64[ns]2012-01-01 ... 2019-08-31
- standard_name :
- time
- axis :
- T
array(['2012-01-01T00:00:00.000000000', '2012-01-02T00:00:00.000000000', '2012-01-03T00:00:00.000000000', ..., '2019-08-29T00:00:00.000000000', '2019-08-30T00:00:00.000000000', '2019-08-31T00:00:00.000000000'], dtype='datetime64[ns]') - Lambert_Conformal()int64...
- crs_wkt :
- PROJCS["undefined",GEOGCS["undefined",DATUM["undefined",SPHEROID["undefined",6367470,0]],PRIMEM["Greenwich",0,AUTHORITY["EPSG","8901"]],UNIT["degree",0.0174532925199433]],PROJECTION["Lambert_Conformal_Conic_1SP"],PARAMETER["latitude_of_origin",53.5],PARAMETER["central_meridian",5],PARAMETER["scale_factor",1],PARAMETER["false_easting",1481641.67696368],PARAMETER["false_northing",537326.063885016],UNIT["metre",1,AUTHORITY["EPSG","9001"]],AXIS["Easting",EAST],AXIS["Northing",NORTH]]
- semi_major_axis :
- 6367470.0
- semi_minor_axis :
- 6367470.0
- inverse_flattening :
- 0.0
- reference_ellipsoid_name :
- undefined
- longitude_of_prime_meridian :
- 0.0
- prime_meridian_name :
- Greenwich
- geographic_crs_name :
- undefined
- horizontal_datum_name :
- undefined
- projected_crs_name :
- undefined
- grid_mapping_name :
- lambert_conformal_conic
- standard_parallel :
- 53.5
- longitude_of_central_meridian :
- 5.0
- false_easting :
- 1481641.67696368
- false_northing :
- 537326.063885016
- spatial_ref :
- PROJCS["undefined",GEOGCS["undefined",DATUM["undefined",SPHEROID["undefined",6367470,0]],PRIMEM["Greenwich",0,AUTHORITY["EPSG","8901"]],UNIT["degree",0.0174532925199433]],PROJECTION["Lambert_Conformal_Conic_1SP"],PARAMETER["latitude_of_origin",53.5],PARAMETER["central_meridian",5],PARAMETER["scale_factor",1],PARAMETER["false_easting",1481641.67696368],PARAMETER["false_northing",537326.063885016],UNIT["metre",1,AUTHORITY["EPSG","9001"]],AXIS["Easting",EAST],AXIS["Northing",NORTH]]
- GeoTransform :
- 413750.0 2500.0 0.0 406250.0 0.0 2500.0
[1 values with dtype=int64]
- spatial_ref()int64...
- crs_wkt :
- PROJCS["undefined",GEOGCS["undefined",DATUM["undefined",SPHEROID["undefined",6367470,0]],PRIMEM["Greenwich",0,AUTHORITY["EPSG","8901"]],UNIT["degree",0.0174532925199433]],PROJECTION["Lambert_Conformal_Conic_1SP"],PARAMETER["latitude_of_origin",53.5],PARAMETER["central_meridian",5],PARAMETER["scale_factor",1],PARAMETER["false_easting",1481641.67696368],PARAMETER["false_northing",537326.063885016],UNIT["metre",1,AUTHORITY["EPSG","9001"]],AXIS["Easting",EAST],AXIS["Northing",NORTH]]
- semi_major_axis :
- 6367470.0
- semi_minor_axis :
- 6367470.0
- inverse_flattening :
- 0.0
- reference_ellipsoid_name :
- undefined
- longitude_of_prime_meridian :
- 0.0
- prime_meridian_name :
- Greenwich
- geographic_crs_name :
- undefined
- horizontal_datum_name :
- undefined
- projected_crs_name :
- undefined
- grid_mapping_name :
- lambert_conformal_conic
- standard_parallel :
- 53.5
- longitude_of_central_meridian :
- 5.0
- false_easting :
- 1481641.67696368
- false_northing :
- 537326.063885016
- spatial_ref :
- PROJCS["undefined",GEOGCS["undefined",DATUM["undefined",SPHEROID["undefined",6367470,0]],PRIMEM["Greenwich",0,AUTHORITY["EPSG","8901"]],UNIT["degree",0.0174532925199433]],PROJECTION["Lambert_Conformal_Conic_1SP"],PARAMETER["latitude_of_origin",53.5],PARAMETER["central_meridian",5],PARAMETER["scale_factor",1],PARAMETER["false_easting",1481641.67696368],PARAMETER["false_northing",537326.063885016],UNIT["metre",1,AUTHORITY["EPSG","9001"]],AXIS["Easting",EAST],AXIS["Northing",NORTH]]
- GeoTransform :
- 413750.0 2500.0 0.0 406250.0 0.0 2500.0
[1 values with dtype=int64]
- grad(time, y, x)float32dask.array<chunksize=(2181, 127, 121), meta=np.ndarray>
- GRIB_paramId :
- 233253117
- GRIB_numberOfPoints :
- 258681
- GRIB_typeOfLevel :
- heightAboveGround
- GRIB_stepUnits :
- 1
- GRIB_stepType :
- accum
- GRIB_gridType :
- lambert
- GRIB_DxInMetres :
- 2500
- GRIB_DyInMetres :
- 2500
- GRIB_LaDInDegrees :
- 53.5
- GRIB_Latin1InDegrees :
- 53.5
- GRIB_Latin2InDegrees :
- 53.5
- GRIB_LoVInDegrees :
- 5.0
- GRIB_NV :
- 132
- GRIB_Nx :
- 529
- GRIB_Ny :
- 489
- GRIB_cfName :
- unknown
- GRIB_cfVarName :
- unknown
- GRIB_gridDefinitionDescription :
- Lambert Conformal
- GRIB_iScansNegatively :
- 0
- GRIB_jPointsAreConsecutive :
- 0
- GRIB_jScansPositively :
- 1
- GRIB_latitudeOfFirstGridPointInDegrees :
- 46.834
- GRIB_latitudeOfSouthernPoleInDegrees :
- 0.0
- GRIB_longitudeOfFirstGridPointInDegrees :
- -14.609
- GRIB_longitudeOfSouthernPoleInDegrees :
- 0.0
- GRIB_missingValue :
- 3.4028234663852886e+38
- GRIB_name :
- Global radiation flux
- GRIB_shortName :
- grad
- GRIB_units :
- W m**-2
- long_name :
- Global radiation flux
- units :
- MJ m⁻² day⁻¹
- standard_name :
- unknown
Array Chunk Bytes 280.15 MiB 127.85 MiB Shape (2800, 166, 158) (2181, 127, 121) Dask graph 8 chunks in 3 graph layers Data type float32 numpy.ndarray
- xPandasIndex
PandasIndex(Float64Index([415000.0, 417500.0, 420000.0, 422500.0, 425000.0, 427500.0, 430000.0, 432500.0, 435000.0, 437500.0, ... 785000.0, 787500.0, 790000.0, 792500.0, 795000.0, 797500.0, 800000.0, 802500.0, 805000.0, 807500.0], dtype='float64', name='x', length=158)) - yPandasIndex
PandasIndex(Float64Index([407500.0, 410000.0, 412500.0, 415000.0, 417500.0, 420000.0, 422500.0, 425000.0, 427500.0, 430000.0, ... 797500.0, 800000.0, 802500.0, 805000.0, 807500.0, 810000.0, 812500.0, 815000.0, 817500.0, 820000.0], dtype='float64', name='y', length=166)) - timePandasIndex
PandasIndex(DatetimeIndex(['2012-01-01', '2012-01-02', '2012-01-03', '2012-01-04',
               '2012-01-05', '2012-01-06', '2012-01-07', '2012-01-08',
               '2012-01-09', '2012-01-10',
               ...
               '2019-08-22', '2019-08-23', '2019-08-24', '2019-08-25',
               '2019-08-26', '2019-08-27', '2019-08-28', '2019-08-29',
               '2019-08-30', '2019-08-31'],
              dtype='datetime64[ns]', name='time', length=2800, freq=None))
- CDI :
- Climate Data Interface version 2.0.5 (https://mpimet.mpg.de/cdi)
- Conventions :
- CF-1.6
- history :
- Sat Apr 15 21:01:13 2023: cdo -s -f nc4c -shifttime,-3hour -copy -seltimestep,3/744/3 /run/media/nms/MyPassport/MERA/grib/117_105_0_4_FC3hr/temp/MERA_PRODYEAR_2012_01_117_105_0_4_FC3hr /run/media/nms/MyPassport/MERA/grib/117_105_0_4_FC3hr/temp/MERA_PRODYEAR_2012_01_117_105_0_4_FC3hr.nc
- CDO :
- Climate Data Operators version 2.0.5 (https://mpimet.mpg.de/cdo)
ds2
<xarray.Dataset>
Dimensions:            (x: 158, y: 166, time: 2800)
Coordinates:
  * x                  (x) float64 4.15e+05 4.175e+05 ... 8.05e+05 8.075e+05
  * y                  (y) float64 4.075e+05 4.1e+05 ... 8.175e+05 8.2e+05
    height             float64 0.0
    Lambert_Conformal  int64 ...
  * time               (time) datetime64[ns] 2012-01-01 ... 2019-08-31
    spatial_ref        int64 ...
Data variables:
    nswrs              (time, y, x) float32 dask.array<chunksize=(2181, 127, 121), meta=np.ndarray>
Attributes:
    CDI:          Climate Data Interface version 2.0.5 (https://mpimet.mpg.de...
    Conventions:  CF-1.6
    history:      Fri Apr 14 14:07:36 2023: cdo -s -f nc4c -shifttime,-3hour ...
    CDO:          Climate Data Operators version 2.0.5 (https://mpimet.mpg.de...
xarray.Dataset
- x: 158
- y: 166
- time: 2800
- x(x)float644.15e+05 4.175e+05 ... 8.075e+05
- standard_name :
- projection_x_coordinate
- units :
- metre
- axis :
- X
- long_name :
- x coordinate of projection
array([415000., 417500., 420000., 422500., 425000., 427500., 430000., 432500., 435000., 437500., 440000., 442500., 445000., 447500., 450000., 452500., 455000., 457500., 460000., 462500., 465000., 467500., 470000., 472500., 475000., 477500., 480000., 482500., 485000., 487500., 490000., 492500., 495000., 497500., 500000., 502500., 505000., 507500., 510000., 512500., 515000., 517500., 520000., 522500., 525000., 527500., 530000., 532500., 535000., 537500., 540000., 542500., 545000., 547500., 550000., 552500., 555000., 557500., 560000., 562500., 565000., 567500., 570000., 572500., 575000., 577500., 580000., 582500., 585000., 587500., 590000., 592500., 595000., 597500., 600000., 602500., 605000., 607500., 610000., 612500., 615000., 617500., 620000., 622500., 625000., 627500., 630000., 632500., 635000., 637500., 640000., 642500., 645000., 647500., 650000., 652500., 655000., 657500., 660000., 662500., 665000., 667500., 670000., 672500., 675000., 677500., 680000., 682500., 685000., 687500., 690000., 692500., 695000., 697500., 700000., 702500., 705000., 707500., 710000., 712500., 715000., 717500., 720000., 722500., 725000., 727500., 730000., 732500., 735000., 737500., 740000., 742500., 745000., 747500., 750000., 752500., 755000., 757500., 760000., 762500., 765000., 767500., 770000., 772500., 775000., 777500., 780000., 782500., 785000., 787500., 790000., 792500., 795000., 797500., 800000., 802500., 805000., 807500.]) - y(y)float644.075e+05 4.1e+05 ... 8.2e+05
- standard_name :
- projection_y_coordinate
- units :
- metre
- axis :
- Y
- long_name :
- y coordinate of projection
array([407500., 410000., 412500., 415000., 417500., 420000., 422500., 425000., 427500., 430000., 432500., 435000., 437500., 440000., 442500., 445000., 447500., 450000., 452500., 455000., 457500., 460000., 462500., 465000., 467500., 470000., 472500., 475000., 477500., 480000., 482500., 485000., 487500., 490000., 492500., 495000., 497500., 500000., 502500., 505000., 507500., 510000., 512500., 515000., 517500., 520000., 522500., 525000., 527500., 530000., 532500., 535000., 537500., 540000., 542500., 545000., 547500., 550000., 552500., 555000., 557500., 560000., 562500., 565000., 567500., 570000., 572500., 575000., 577500., 580000., 582500., 585000., 587500., 590000., 592500., 595000., 597500., 600000., 602500., 605000., 607500., 610000., 612500., 615000., 617500., 620000., 622500., 625000., 627500., 630000., 632500., 635000., 637500., 640000., 642500., 645000., 647500., 650000., 652500., 655000., 657500., 660000., 662500., 665000., 667500., 670000., 672500., 675000., 677500., 680000., 682500., 685000., 687500., 690000., 692500., 695000., 697500., 700000., 702500., 705000., 707500., 710000., 712500., 715000., 717500., 720000., 722500., 725000., 727500., 730000., 732500., 735000., 737500., 740000., 742500., 745000., 747500., 750000., 752500., 755000., 757500., 760000., 762500., 765000., 767500., 770000., 772500., 775000., 777500., 780000., 782500., 785000., 787500., 790000., 792500., 795000., 797500., 800000., 802500., 805000., 807500., 810000., 812500., 815000., 817500., 820000.]) - height()float640.0
- standard_name :
- height
- long_name :
- height
- units :
- m
- positive :
- up
- axis :
- Z
array(0.)
- Lambert_Conformal()int64...
- crs_wkt :
- PROJCS["undefined",GEOGCS["undefined",DATUM["undefined",SPHEROID["undefined",6367470,0]],PRIMEM["Greenwich",0,AUTHORITY["EPSG","8901"]],UNIT["degree",0.0174532925199433]],PROJECTION["Lambert_Conformal_Conic_1SP"],PARAMETER["latitude_of_origin",53.5],PARAMETER["central_meridian",5],PARAMETER["scale_factor",1],PARAMETER["false_easting",1481641.67696368],PARAMETER["false_northing",537326.063885016],UNIT["metre",1,AUTHORITY["EPSG","9001"]],AXIS["Easting",EAST],AXIS["Northing",NORTH]]
- semi_major_axis :
- 6367470.0
- semi_minor_axis :
- 6367470.0
- inverse_flattening :
- 0.0
- reference_ellipsoid_name :
- undefined
- longitude_of_prime_meridian :
- 0.0
- prime_meridian_name :
- Greenwich
- geographic_crs_name :
- undefined
- horizontal_datum_name :
- undefined
- projected_crs_name :
- undefined
- grid_mapping_name :
- lambert_conformal_conic
- standard_parallel :
- 53.5
- longitude_of_central_meridian :
- 5.0
- false_easting :
- 1481641.67696368
- false_northing :
- 537326.063885016
- spatial_ref :
- PROJCS["undefined",GEOGCS["undefined",DATUM["undefined",SPHEROID["undefined",6367470,0]],PRIMEM["Greenwich",0,AUTHORITY["EPSG","8901"]],UNIT["degree",0.0174532925199433]],PROJECTION["Lambert_Conformal_Conic_1SP"],PARAMETER["latitude_of_origin",53.5],PARAMETER["central_meridian",5],PARAMETER["scale_factor",1],PARAMETER["false_easting",1481641.67696368],PARAMETER["false_northing",537326.063885016],UNIT["metre",1,AUTHORITY["EPSG","9001"]],AXIS["Easting",EAST],AXIS["Northing",NORTH]]
- GeoTransform :
- 413750.0 2500.0 0.0 406250.0 0.0 2500.0
[1 values with dtype=int64]
- time(time)datetime64[ns]2012-01-01 ... 2019-08-31
- standard_name :
- time
- axis :
- T
array(['2012-01-01T00:00:00.000000000', '2012-01-02T00:00:00.000000000', '2012-01-03T00:00:00.000000000', ..., '2019-08-29T00:00:00.000000000', '2019-08-30T00:00:00.000000000', '2019-08-31T00:00:00.000000000'], dtype='datetime64[ns]') - spatial_ref()int64...
- crs_wkt :
- PROJCS["undefined",GEOGCS["undefined",DATUM["undefined",SPHEROID["undefined",6367470,0]],PRIMEM["Greenwich",0,AUTHORITY["EPSG","8901"]],UNIT["degree",0.0174532925199433]],PROJECTION["Lambert_Conformal_Conic_1SP"],PARAMETER["latitude_of_origin",53.5],PARAMETER["central_meridian",5],PARAMETER["scale_factor",1],PARAMETER["false_easting",1481641.67696368],PARAMETER["false_northing",537326.063885016],UNIT["metre",1,AUTHORITY["EPSG","9001"]],AXIS["Easting",EAST],AXIS["Northing",NORTH]]
- semi_major_axis :
- 6367470.0
- semi_minor_axis :
- 6367470.0
- inverse_flattening :
- 0.0
- reference_ellipsoid_name :
- undefined
- longitude_of_prime_meridian :
- 0.0
- prime_meridian_name :
- Greenwich
- geographic_crs_name :
- undefined
- horizontal_datum_name :
- undefined
- projected_crs_name :
- undefined
- grid_mapping_name :
- lambert_conformal_conic
- standard_parallel :
- 53.5
- longitude_of_central_meridian :
- 5.0
- false_easting :
- 1481641.67696368
- false_northing :
- 537326.063885016
- spatial_ref :
- PROJCS["undefined",GEOGCS["undefined",DATUM["undefined",SPHEROID["undefined",6367470,0]],PRIMEM["Greenwich",0,AUTHORITY["EPSG","8901"]],UNIT["degree",0.0174532925199433]],PROJECTION["Lambert_Conformal_Conic_1SP"],PARAMETER["latitude_of_origin",53.5],PARAMETER["central_meridian",5],PARAMETER["scale_factor",1],PARAMETER["false_easting",1481641.67696368],PARAMETER["false_northing",537326.063885016],UNIT["metre",1,AUTHORITY["EPSG","9001"]],AXIS["Easting",EAST],AXIS["Northing",NORTH]]
- GeoTransform :
- 413750.0 2500.0 0.0 406250.0 0.0 2500.0
[1 values with dtype=int64]
- nswrs(time, y, x)float32dask.array<chunksize=(2181, 127, 121), meta=np.ndarray>
- GRIB_paramId :
- 233253111
- GRIB_numberOfPoints :
- 258681
- GRIB_typeOfLevel :
- heightAboveGround
- GRIB_stepUnits :
- 1
- GRIB_stepType :
- accum
- GRIB_gridType :
- lambert
- GRIB_DxInMetres :
- 2500
- GRIB_DyInMetres :
- 2500
- GRIB_LaDInDegrees :
- 53.5
- GRIB_Latin1InDegrees :
- 53.5
- GRIB_Latin2InDegrees :
- 53.5
- GRIB_LoVInDegrees :
- 5.0
- GRIB_NV :
- 132
- GRIB_Nx :
- 529
- GRIB_Ny :
- 489
- GRIB_cfName :
- unknown
- GRIB_cfVarName :
- unknown
- GRIB_gridDefinitionDescription :
- Lambert Conformal
- GRIB_iScansNegatively :
- 0
- GRIB_jPointsAreConsecutive :
- 0
- GRIB_jScansPositively :
- 1
- GRIB_latitudeOfFirstGridPointInDegrees :
- 46.834
- GRIB_latitudeOfSouthernPoleInDegrees :
- 0.0
- GRIB_longitudeOfFirstGridPointInDegrees :
- -14.609
- GRIB_longitudeOfSouthernPoleInDegrees :
- 0.0
- GRIB_missingValue :
- 3.4028234663852886e+38
- GRIB_name :
- Net short-wave radiation flux (surface)
- GRIB_shortName :
- nswrs
- GRIB_units :
- W m**-2
- long_name :
- Net short-wave radiation flux (surface)
- units :
- MJ m⁻² day⁻¹
- standard_name :
- unknown
Array Chunk Bytes 280.15 MiB 127.85 MiB Shape (2800, 166, 158) (2181, 127, 121) Dask graph 8 chunks in 3 graph layers Data type float32 numpy.ndarray
- xPandasIndex
PandasIndex(Float64Index([415000.0, 417500.0, 420000.0, 422500.0, 425000.0, 427500.0, 430000.0, 432500.0, 435000.0, 437500.0, ... 785000.0, 787500.0, 790000.0, 792500.0, 795000.0, 797500.0, 800000.0, 802500.0, 805000.0, 807500.0], dtype='float64', name='x', length=158)) - yPandasIndex
PandasIndex(Float64Index([407500.0, 410000.0, 412500.0, 415000.0, 417500.0, 420000.0, 422500.0, 425000.0, 427500.0, 430000.0, ... 797500.0, 800000.0, 802500.0, 805000.0, 807500.0, 810000.0, 812500.0, 815000.0, 817500.0, 820000.0], dtype='float64', name='y', length=166)) - timePandasIndex
PandasIndex(DatetimeIndex(['2012-01-01', '2012-01-02', '2012-01-03', '2012-01-04',
               '2012-01-05', '2012-01-06', '2012-01-07', '2012-01-08',
               '2012-01-09', '2012-01-10',
               ...
               '2019-08-22', '2019-08-23', '2019-08-24', '2019-08-25',
               '2019-08-26', '2019-08-27', '2019-08-28', '2019-08-29',
               '2019-08-30', '2019-08-31'],
              dtype='datetime64[ns]', name='time', length=2800, freq=None))
- CDI :
- Climate Data Interface version 2.0.5 (https://mpimet.mpg.de/cdi)
- Conventions :
- CF-1.6
- history :
- Fri Apr 14 14:07:36 2023: cdo -s -f nc4c -shifttime,-3hour -copy -seltimestep,3/744/3 /run/media/nms/Elements/MERA/grib/111_105_0_4_FC3hr/temp/MERA_PRODYEAR_2012_01_111_105_0_4_FC3hr /run/media/nms/Elements/MERA/grib/111_105_0_4_FC3hr/temp/MERA_PRODYEAR_2012_01_111_105_0_4_FC3hr.nc
- CDO :
- Climate Data Operators version 2.0.5 (https://mpimet.mpg.de/cdo)
Visualise#
# Moorepark, Fermoy met station coords
LON, LAT = -8.26389, 52.16389
# transform coordinates from lon/lat to Lambert Conformal Conic
XLON, YLAT = cplt.projection_lambert_conformal.transform_point(
    x=LON, y=LAT, src_crs=ccrs.PlateCarree()
)
def plot_map(data, var, cmap="Spectral_r"):
    """
    Helper function for plotting maps
    """

    plt.figure(figsize=(9, 7))
    ax = plt.axes(projection=cplt.projection_lambert_conformal)
    data.isel(time=120)[var].plot.contourf(
        ax=ax,
        robust=True,
        x="x",
        y="y",
        levels=10,
        transform=cplt.projection_lambert_conformal,
        cmap=cmap,
        cbar_kwargs={
            "label": (
                data[var].attrs["long_name"]
                + " ["
                + data[var].attrs["units"]
                + "]"
            )
        },
    )
    ax.gridlines(
        draw_labels=dict(bottom="x", left="y"),
        color="lightslategrey",
        linewidth=0.5,
        x_inline=False,
        y_inline=False,
    )
    ax.coastlines(resolution="10m", color="darkslategrey", linewidth=0.75)
    ax.set_title(str(data.isel(time=90)["time"].values))
    plt.tight_layout()
    plt.show()
def plot_ts(data, var, sub=True):
    """
    Helper function for plotting time series
    """

    plt.figure(figsize=(12, 4))
    data_ts = data.sel({"x": XLON, "y": YLAT}, method="nearest")
    if sub:
        data_ts = data_ts.sel(time=slice("2013-04", "2013-06"))
    plt.plot(data_ts["time"], data_ts[var])
    # plt.title(
    #     data[var].attrs["long_name"] + " [" + data[var].attrs["units"] + "]"
    # )
    plt.tight_layout()
    plt.show()
ds_ = ds.sel({"x": XLON, "y": YLAT}, method="nearest")
ds2_ = ds2.sel({"x": XLON, "y": YLAT}, method="nearest")
ds_ = ds_.sel(time=slice("2013-04", "2013-06"))
ds2_ = ds2_.sel(time=slice("2013-04", "2013-06"))
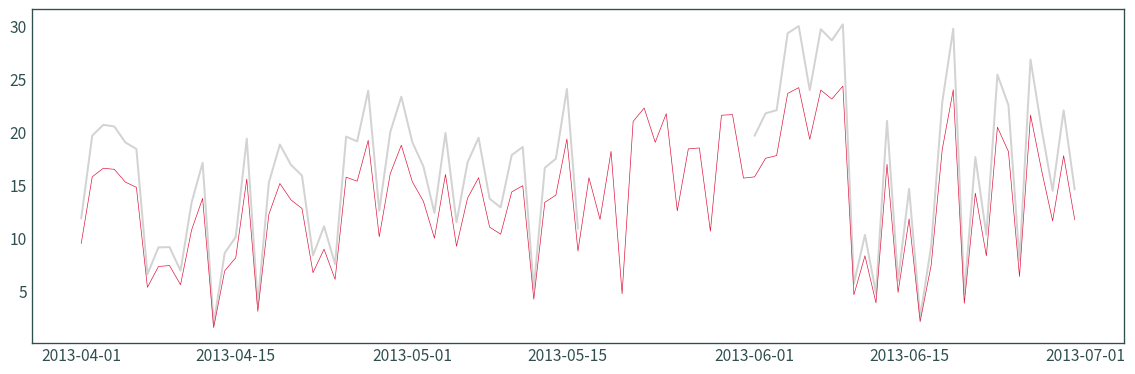
fig = plt.figure(figsize=(12, 4))
plt.plot(ds_["time"], ds_["grad"], color="lightgrey")
plt.plot(ds2_["time"], ds2_["nswrs"], color="crimson", linewidth=0.5)
# plt.title(
# data[var].attrs["long_name"] + " [" + data[var].attrs["units"] + "]"
# )
plt.tight_layout()
plt.show()
Ratio#
ds3 = ds.copy()
ds3 = ds3.assign(nswrs=ds2["nswrs"])
ds3 = ds3.assign(ratio=ds3["grad"] / ds3["nswrs"])
ds3
<xarray.Dataset>
Dimensions:            (x: 158, y: 166, time: 2800)
Coordinates:
  * x                  (x) float64 4.15e+05 4.175e+05 ... 8.05e+05 8.075e+05
  * y                  (y) float64 4.075e+05 4.1e+05 ... 8.175e+05 8.2e+05
    height             float64 0.0
  * time               (time) datetime64[ns] 2012-01-01 ... 2019-08-31
    Lambert_Conformal  int64 ...
    spatial_ref        int64 ...
Data variables:
    grad               (time, y, x) float32 dask.array<chunksize=(2181, 127, 121), meta=np.ndarray>
    nswrs              (time, y, x) float32 dask.array<chunksize=(2181, 127, 121), meta=np.ndarray>
    ratio              (time, y, x) float32 dask.array<chunksize=(2181, 127, 121), meta=np.ndarray>
Attributes:
    CDI:          Climate Data Interface version 2.0.5 (https://mpimet.mpg.de...
    Conventions:  CF-1.6
    history:      Sat Apr 15 21:01:13 2023: cdo -s -f nc4c -shifttime,-3hour ...
    CDO:          Climate Data Operators version 2.0.5 (https://mpimet.mpg.de...
xarray.Dataset
- x: 158
- y: 166
- time: 2800
- x(x)float644.15e+05 4.175e+05 ... 8.075e+05
- standard_name :
- projection_x_coordinate
- units :
- metre
- axis :
- X
- long_name :
- x coordinate of projection
array([415000., 417500., 420000., 422500., 425000., 427500., 430000., 432500., 435000., 437500., 440000., 442500., 445000., 447500., 450000., 452500., 455000., 457500., 460000., 462500., 465000., 467500., 470000., 472500., 475000., 477500., 480000., 482500., 485000., 487500., 490000., 492500., 495000., 497500., 500000., 502500., 505000., 507500., 510000., 512500., 515000., 517500., 520000., 522500., 525000., 527500., 530000., 532500., 535000., 537500., 540000., 542500., 545000., 547500., 550000., 552500., 555000., 557500., 560000., 562500., 565000., 567500., 570000., 572500., 575000., 577500., 580000., 582500., 585000., 587500., 590000., 592500., 595000., 597500., 600000., 602500., 605000., 607500., 610000., 612500., 615000., 617500., 620000., 622500., 625000., 627500., 630000., 632500., 635000., 637500., 640000., 642500., 645000., 647500., 650000., 652500., 655000., 657500., 660000., 662500., 665000., 667500., 670000., 672500., 675000., 677500., 680000., 682500., 685000., 687500., 690000., 692500., 695000., 697500., 700000., 702500., 705000., 707500., 710000., 712500., 715000., 717500., 720000., 722500., 725000., 727500., 730000., 732500., 735000., 737500., 740000., 742500., 745000., 747500., 750000., 752500., 755000., 757500., 760000., 762500., 765000., 767500., 770000., 772500., 775000., 777500., 780000., 782500., 785000., 787500., 790000., 792500., 795000., 797500., 800000., 802500., 805000., 807500.]) - y(y)float644.075e+05 4.1e+05 ... 8.2e+05
- standard_name :
- projection_y_coordinate
- units :
- metre
- axis :
- Y
- long_name :
- y coordinate of projection
array([407500., 410000., 412500., 415000., 417500., 420000., 422500., 425000., 427500., 430000., 432500., 435000., 437500., 440000., 442500., 445000., 447500., 450000., 452500., 455000., 457500., 460000., 462500., 465000., 467500., 470000., 472500., 475000., 477500., 480000., 482500., 485000., 487500., 490000., 492500., 495000., 497500., 500000., 502500., 505000., 507500., 510000., 512500., 515000., 517500., 520000., 522500., 525000., 527500., 530000., 532500., 535000., 537500., 540000., 542500., 545000., 547500., 550000., 552500., 555000., 557500., 560000., 562500., 565000., 567500., 570000., 572500., 575000., 577500., 580000., 582500., 585000., 587500., 590000., 592500., 595000., 597500., 600000., 602500., 605000., 607500., 610000., 612500., 615000., 617500., 620000., 622500., 625000., 627500., 630000., 632500., 635000., 637500., 640000., 642500., 645000., 647500., 650000., 652500., 655000., 657500., 660000., 662500., 665000., 667500., 670000., 672500., 675000., 677500., 680000., 682500., 685000., 687500., 690000., 692500., 695000., 697500., 700000., 702500., 705000., 707500., 710000., 712500., 715000., 717500., 720000., 722500., 725000., 727500., 730000., 732500., 735000., 737500., 740000., 742500., 745000., 747500., 750000., 752500., 755000., 757500., 760000., 762500., 765000., 767500., 770000., 772500., 775000., 777500., 780000., 782500., 785000., 787500., 790000., 792500., 795000., 797500., 800000., 802500., 805000., 807500., 810000., 812500., 815000., 817500., 820000.]) - height()float640.0
- standard_name :
- height
- long_name :
- height
- units :
- m
- positive :
- up
- axis :
- Z
array(0.)
- time(time)datetime64[ns]2012-01-01 ... 2019-08-31
- standard_name :
- time
- axis :
- T
array(['2012-01-01T00:00:00.000000000', '2012-01-02T00:00:00.000000000', '2012-01-03T00:00:00.000000000', ..., '2019-08-29T00:00:00.000000000', '2019-08-30T00:00:00.000000000', '2019-08-31T00:00:00.000000000'], dtype='datetime64[ns]') - Lambert_Conformal()int64...
- crs_wkt :
- PROJCS["undefined",GEOGCS["undefined",DATUM["undefined",SPHEROID["undefined",6367470,0]],PRIMEM["Greenwich",0,AUTHORITY["EPSG","8901"]],UNIT["degree",0.0174532925199433]],PROJECTION["Lambert_Conformal_Conic_1SP"],PARAMETER["latitude_of_origin",53.5],PARAMETER["central_meridian",5],PARAMETER["scale_factor",1],PARAMETER["false_easting",1481641.67696368],PARAMETER["false_northing",537326.063885016],UNIT["metre",1,AUTHORITY["EPSG","9001"]],AXIS["Easting",EAST],AXIS["Northing",NORTH]]
- semi_major_axis :
- 6367470.0
- semi_minor_axis :
- 6367470.0
- inverse_flattening :
- 0.0
- reference_ellipsoid_name :
- undefined
- longitude_of_prime_meridian :
- 0.0
- prime_meridian_name :
- Greenwich
- geographic_crs_name :
- undefined
- horizontal_datum_name :
- undefined
- projected_crs_name :
- undefined
- grid_mapping_name :
- lambert_conformal_conic
- standard_parallel :
- 53.5
- longitude_of_central_meridian :
- 5.0
- false_easting :
- 1481641.67696368
- false_northing :
- 537326.063885016
- spatial_ref :
- PROJCS["undefined",GEOGCS["undefined",DATUM["undefined",SPHEROID["undefined",6367470,0]],PRIMEM["Greenwich",0,AUTHORITY["EPSG","8901"]],UNIT["degree",0.0174532925199433]],PROJECTION["Lambert_Conformal_Conic_1SP"],PARAMETER["latitude_of_origin",53.5],PARAMETER["central_meridian",5],PARAMETER["scale_factor",1],PARAMETER["false_easting",1481641.67696368],PARAMETER["false_northing",537326.063885016],UNIT["metre",1,AUTHORITY["EPSG","9001"]],AXIS["Easting",EAST],AXIS["Northing",NORTH]]
- GeoTransform :
- 413750.0 2500.0 0.0 406250.0 0.0 2500.0
[1 values with dtype=int64]
- spatial_ref()int64...
- crs_wkt :
- PROJCS["undefined",GEOGCS["undefined",DATUM["undefined",SPHEROID["undefined",6367470,0]],PRIMEM["Greenwich",0,AUTHORITY["EPSG","8901"]],UNIT["degree",0.0174532925199433]],PROJECTION["Lambert_Conformal_Conic_1SP"],PARAMETER["latitude_of_origin",53.5],PARAMETER["central_meridian",5],PARAMETER["scale_factor",1],PARAMETER["false_easting",1481641.67696368],PARAMETER["false_northing",537326.063885016],UNIT["metre",1,AUTHORITY["EPSG","9001"]],AXIS["Easting",EAST],AXIS["Northing",NORTH]]
- semi_major_axis :
- 6367470.0
- semi_minor_axis :
- 6367470.0
- inverse_flattening :
- 0.0
- reference_ellipsoid_name :
- undefined
- longitude_of_prime_meridian :
- 0.0
- prime_meridian_name :
- Greenwich
- geographic_crs_name :
- undefined
- horizontal_datum_name :
- undefined
- projected_crs_name :
- undefined
- grid_mapping_name :
- lambert_conformal_conic
- standard_parallel :
- 53.5
- longitude_of_central_meridian :
- 5.0
- false_easting :
- 1481641.67696368
- false_northing :
- 537326.063885016
- spatial_ref :
- PROJCS["undefined",GEOGCS["undefined",DATUM["undefined",SPHEROID["undefined",6367470,0]],PRIMEM["Greenwich",0,AUTHORITY["EPSG","8901"]],UNIT["degree",0.0174532925199433]],PROJECTION["Lambert_Conformal_Conic_1SP"],PARAMETER["latitude_of_origin",53.5],PARAMETER["central_meridian",5],PARAMETER["scale_factor",1],PARAMETER["false_easting",1481641.67696368],PARAMETER["false_northing",537326.063885016],UNIT["metre",1,AUTHORITY["EPSG","9001"]],AXIS["Easting",EAST],AXIS["Northing",NORTH]]
- GeoTransform :
- 413750.0 2500.0 0.0 406250.0 0.0 2500.0
[1 values with dtype=int64]
- grad(time, y, x)float32dask.array<chunksize=(2181, 127, 121), meta=np.ndarray>
- GRIB_paramId :
- 233253117
- GRIB_numberOfPoints :
- 258681
- GRIB_typeOfLevel :
- heightAboveGround
- GRIB_stepUnits :
- 1
- GRIB_stepType :
- accum
- GRIB_gridType :
- lambert
- GRIB_DxInMetres :
- 2500
- GRIB_DyInMetres :
- 2500
- GRIB_LaDInDegrees :
- 53.5
- GRIB_Latin1InDegrees :
- 53.5
- GRIB_Latin2InDegrees :
- 53.5
- GRIB_LoVInDegrees :
- 5.0
- GRIB_NV :
- 132
- GRIB_Nx :
- 529
- GRIB_Ny :
- 489
- GRIB_cfName :
- unknown
- GRIB_cfVarName :
- unknown
- GRIB_gridDefinitionDescription :
- Lambert Conformal
- GRIB_iScansNegatively :
- 0
- GRIB_jPointsAreConsecutive :
- 0
- GRIB_jScansPositively :
- 1
- GRIB_latitudeOfFirstGridPointInDegrees :
- 46.834
- GRIB_latitudeOfSouthernPoleInDegrees :
- 0.0
- GRIB_longitudeOfFirstGridPointInDegrees :
- -14.609
- GRIB_longitudeOfSouthernPoleInDegrees :
- 0.0
- GRIB_missingValue :
- 3.4028234663852886e+38
- GRIB_name :
- Global radiation flux
- GRIB_shortName :
- grad
- GRIB_units :
- W m**-2
- long_name :
- Global radiation flux
- units :
- MJ m⁻² day⁻¹
- standard_name :
- unknown
Array Chunk Bytes 280.15 MiB 127.85 MiB Shape (2800, 166, 158) (2181, 127, 121) Dask graph 8 chunks in 3 graph layers Data type float32 numpy.ndarray - nswrs(time, y, x)float32dask.array<chunksize=(2181, 127, 121), meta=np.ndarray>
- GRIB_paramId :
- 233253111
- GRIB_numberOfPoints :
- 258681
- GRIB_typeOfLevel :
- heightAboveGround
- GRIB_stepUnits :
- 1
- GRIB_stepType :
- accum
- GRIB_gridType :
- lambert
- GRIB_DxInMetres :
- 2500
- GRIB_DyInMetres :
- 2500
- GRIB_LaDInDegrees :
- 53.5
- GRIB_Latin1InDegrees :
- 53.5
- GRIB_Latin2InDegrees :
- 53.5
- GRIB_LoVInDegrees :
- 5.0
- GRIB_NV :
- 132
- GRIB_Nx :
- 529
- GRIB_Ny :
- 489
- GRIB_cfName :
- unknown
- GRIB_cfVarName :
- unknown
- GRIB_gridDefinitionDescription :
- Lambert Conformal
- GRIB_iScansNegatively :
- 0
- GRIB_jPointsAreConsecutive :
- 0
- GRIB_jScansPositively :
- 1
- GRIB_latitudeOfFirstGridPointInDegrees :
- 46.834
- GRIB_latitudeOfSouthernPoleInDegrees :
- 0.0
- GRIB_longitudeOfFirstGridPointInDegrees :
- -14.609
- GRIB_longitudeOfSouthernPoleInDegrees :
- 0.0
- GRIB_missingValue :
- 3.4028234663852886e+38
- GRIB_name :
- Net short-wave radiation flux (surface)
- GRIB_shortName :
- nswrs
- GRIB_units :
- W m**-2
- long_name :
- Net short-wave radiation flux (surface)
- units :
- MJ m⁻² day⁻¹
- standard_name :
- unknown
Array Chunk Bytes 280.15 MiB 127.85 MiB Shape (2800, 166, 158) (2181, 127, 121) Dask graph 8 chunks in 3 graph layers Data type float32 numpy.ndarray - ratio(time, y, x)float32dask.array<chunksize=(2181, 127, 121), meta=np.ndarray>
Array Chunk Bytes 280.15 MiB 127.85 MiB Shape (2800, 166, 158) (2181, 127, 121) Dask graph 8 chunks in 7 graph layers Data type float32 numpy.ndarray
- xPandasIndex
PandasIndex(Float64Index([415000.0, 417500.0, 420000.0, 422500.0, 425000.0, 427500.0, 430000.0, 432500.0, 435000.0, 437500.0, ... 785000.0, 787500.0, 790000.0, 792500.0, 795000.0, 797500.0, 800000.0, 802500.0, 805000.0, 807500.0], dtype='float64', name='x', length=158)) - yPandasIndex
PandasIndex(Float64Index([407500.0, 410000.0, 412500.0, 415000.0, 417500.0, 420000.0, 422500.0, 425000.0, 427500.0, 430000.0, ... 797500.0, 800000.0, 802500.0, 805000.0, 807500.0, 810000.0, 812500.0, 815000.0, 817500.0, 820000.0], dtype='float64', name='y', length=166)) - timePandasIndex
PandasIndex(DatetimeIndex(['2012-01-01', '2012-01-02', '2012-01-03', '2012-01-04',
               '2012-01-05', '2012-01-06', '2012-01-07', '2012-01-08',
               '2012-01-09', '2012-01-10',
               ...
               '2019-08-22', '2019-08-23', '2019-08-24', '2019-08-25',
               '2019-08-26', '2019-08-27', '2019-08-28', '2019-08-29',
               '2019-08-30', '2019-08-31'],
              dtype='datetime64[ns]', name='time', length=2800, freq=None))
- CDI :
- Climate Data Interface version 2.0.5 (https://mpimet.mpg.de/cdi)
- Conventions :
- CF-1.6
- history :
- Sat Apr 15 21:01:13 2023: cdo -s -f nc4c -shifttime,-3hour -copy -seltimestep,3/744/3 /run/media/nms/MyPassport/MERA/grib/117_105_0_4_FC3hr/temp/MERA_PRODYEAR_2012_01_117_105_0_4_FC3hr /run/media/nms/MyPassport/MERA/grib/117_105_0_4_FC3hr/temp/MERA_PRODYEAR_2012_01_117_105_0_4_FC3hr.nc
- CDO :
- Climate Data Operators version 2.0.5 (https://mpimet.mpg.de/cdo)
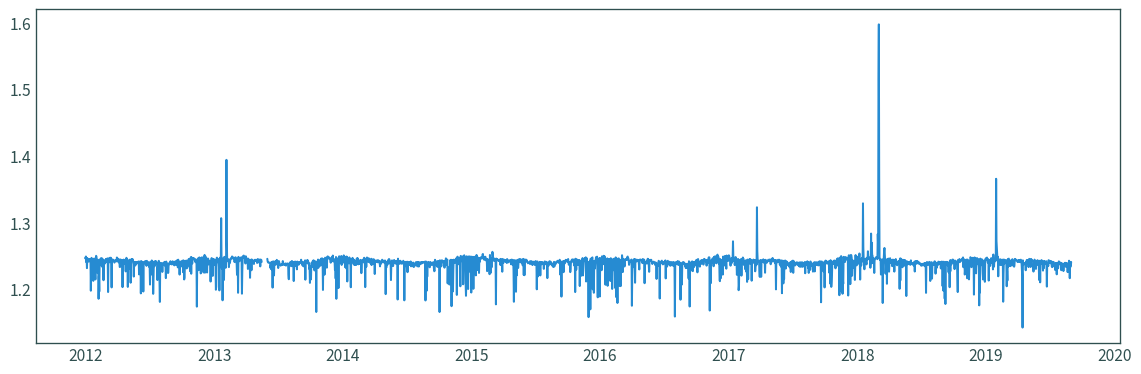
ds3_ = ds3.sel({"x": XLON, "y": YLAT}, method="nearest")
# ds3_ = ds3_.sel(time=slice("2013-04", "2013-06"))
fig = plt.figure(figsize=(12, 4))
plt.plot(ds3_["time"], ds3_["ratio"])
plt.tight_layout()
plt.show()
ds3.mean(dim="time")["ratio"].plot()
plt.tight_layout()
plt.show()
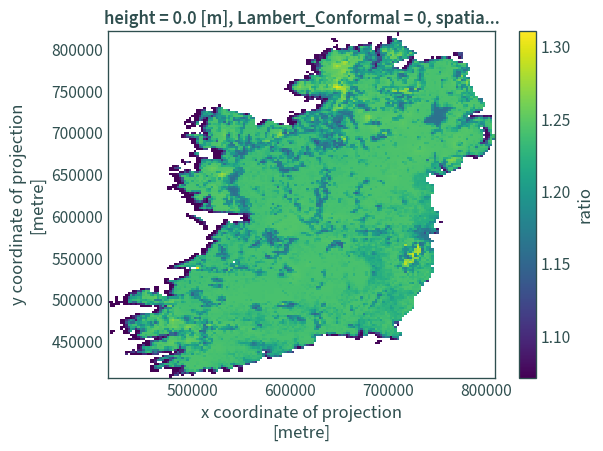
ds3["ratio"].mean(dim=None).values
array(1.2155399, dtype=float32)
(ds3["grad"] / ds3["nswrs"]).mean(dim=None).values
array(1.2155399, dtype=float32)
Adjust#
ds2.assign(grad=ds2["nswrs"] * 1.2155399)
<xarray.Dataset>
Dimensions:            (x: 158, y: 166, time: 2800)
Coordinates:
  * x                  (x) float64 4.15e+05 4.175e+05 ... 8.05e+05 8.075e+05
  * y                  (y) float64 4.075e+05 4.1e+05 ... 8.175e+05 8.2e+05
    height             float64 0.0
    Lambert_Conformal  int64 ...
  * time               (time) datetime64[ns] 2012-01-01 ... 2019-08-31
    spatial_ref        int64 ...
Data variables:
    nswrs              (time, y, x) float32 dask.array<chunksize=(2181, 127, 121), meta=np.ndarray>
    grad               (time, y, x) float32 dask.array<chunksize=(2181, 127, 121), meta=np.ndarray>
Attributes:
    CDI:          Climate Data Interface version 2.0.5 (https://mpimet.mpg.de...
    Conventions:  CF-1.6
    history:      Fri Apr 14 14:07:36 2023: cdo -s -f nc4c -shifttime,-3hour ...
    CDO:          Climate Data Operators version 2.0.5 (https://mpimet.mpg.de...
xarray.Dataset
- x: 158
- y: 166
- time: 2800
- x(x)float644.15e+05 4.175e+05 ... 8.075e+05
- standard_name :
- projection_x_coordinate
- units :
- metre
- axis :
- X
- long_name :
- x coordinate of projection
array([415000., 417500., 420000., 422500., 425000., 427500., 430000., 432500., 435000., 437500., 440000., 442500., 445000., 447500., 450000., 452500., 455000., 457500., 460000., 462500., 465000., 467500., 470000., 472500., 475000., 477500., 480000., 482500., 485000., 487500., 490000., 492500., 495000., 497500., 500000., 502500., 505000., 507500., 510000., 512500., 515000., 517500., 520000., 522500., 525000., 527500., 530000., 532500., 535000., 537500., 540000., 542500., 545000., 547500., 550000., 552500., 555000., 557500., 560000., 562500., 565000., 567500., 570000., 572500., 575000., 577500., 580000., 582500., 585000., 587500., 590000., 592500., 595000., 597500., 600000., 602500., 605000., 607500., 610000., 612500., 615000., 617500., 620000., 622500., 625000., 627500., 630000., 632500., 635000., 637500., 640000., 642500., 645000., 647500., 650000., 652500., 655000., 657500., 660000., 662500., 665000., 667500., 670000., 672500., 675000., 677500., 680000., 682500., 685000., 687500., 690000., 692500., 695000., 697500., 700000., 702500., 705000., 707500., 710000., 712500., 715000., 717500., 720000., 722500., 725000., 727500., 730000., 732500., 735000., 737500., 740000., 742500., 745000., 747500., 750000., 752500., 755000., 757500., 760000., 762500., 765000., 767500., 770000., 772500., 775000., 777500., 780000., 782500., 785000., 787500., 790000., 792500., 795000., 797500., 800000., 802500., 805000., 807500.]) - y(y)float644.075e+05 4.1e+05 ... 8.2e+05
- standard_name :
- projection_y_coordinate
- units :
- metre
- axis :
- Y
- long_name :
- y coordinate of projection
array([407500., 410000., 412500., 415000., 417500., 420000., 422500., 425000., 427500., 430000., 432500., 435000., 437500., 440000., 442500., 445000., 447500., 450000., 452500., 455000., 457500., 460000., 462500., 465000., 467500., 470000., 472500., 475000., 477500., 480000., 482500., 485000., 487500., 490000., 492500., 495000., 497500., 500000., 502500., 505000., 507500., 510000., 512500., 515000., 517500., 520000., 522500., 525000., 527500., 530000., 532500., 535000., 537500., 540000., 542500., 545000., 547500., 550000., 552500., 555000., 557500., 560000., 562500., 565000., 567500., 570000., 572500., 575000., 577500., 580000., 582500., 585000., 587500., 590000., 592500., 595000., 597500., 600000., 602500., 605000., 607500., 610000., 612500., 615000., 617500., 620000., 622500., 625000., 627500., 630000., 632500., 635000., 637500., 640000., 642500., 645000., 647500., 650000., 652500., 655000., 657500., 660000., 662500., 665000., 667500., 670000., 672500., 675000., 677500., 680000., 682500., 685000., 687500., 690000., 692500., 695000., 697500., 700000., 702500., 705000., 707500., 710000., 712500., 715000., 717500., 720000., 722500., 725000., 727500., 730000., 732500., 735000., 737500., 740000., 742500., 745000., 747500., 750000., 752500., 755000., 757500., 760000., 762500., 765000., 767500., 770000., 772500., 775000., 777500., 780000., 782500., 785000., 787500., 790000., 792500., 795000., 797500., 800000., 802500., 805000., 807500., 810000., 812500., 815000., 817500., 820000.]) - height()float640.0
- standard_name :
- height
- long_name :
- height
- units :
- m
- positive :
- up
- axis :
- Z
array(0.)
- Lambert_Conformal()int64...
- crs_wkt :
- PROJCS["undefined",GEOGCS["undefined",DATUM["undefined",SPHEROID["undefined",6367470,0]],PRIMEM["Greenwich",0,AUTHORITY["EPSG","8901"]],UNIT["degree",0.0174532925199433]],PROJECTION["Lambert_Conformal_Conic_1SP"],PARAMETER["latitude_of_origin",53.5],PARAMETER["central_meridian",5],PARAMETER["scale_factor",1],PARAMETER["false_easting",1481641.67696368],PARAMETER["false_northing",537326.063885016],UNIT["metre",1,AUTHORITY["EPSG","9001"]],AXIS["Easting",EAST],AXIS["Northing",NORTH]]
- semi_major_axis :
- 6367470.0
- semi_minor_axis :
- 6367470.0
- inverse_flattening :
- 0.0
- reference_ellipsoid_name :
- undefined
- longitude_of_prime_meridian :
- 0.0
- prime_meridian_name :
- Greenwich
- geographic_crs_name :
- undefined
- horizontal_datum_name :
- undefined
- projected_crs_name :
- undefined
- grid_mapping_name :
- lambert_conformal_conic
- standard_parallel :
- 53.5
- longitude_of_central_meridian :
- 5.0
- false_easting :
- 1481641.67696368
- false_northing :
- 537326.063885016
- spatial_ref :
- PROJCS["undefined",GEOGCS["undefined",DATUM["undefined",SPHEROID["undefined",6367470,0]],PRIMEM["Greenwich",0,AUTHORITY["EPSG","8901"]],UNIT["degree",0.0174532925199433]],PROJECTION["Lambert_Conformal_Conic_1SP"],PARAMETER["latitude_of_origin",53.5],PARAMETER["central_meridian",5],PARAMETER["scale_factor",1],PARAMETER["false_easting",1481641.67696368],PARAMETER["false_northing",537326.063885016],UNIT["metre",1,AUTHORITY["EPSG","9001"]],AXIS["Easting",EAST],AXIS["Northing",NORTH]]
- GeoTransform :
- 413750.0 2500.0 0.0 406250.0 0.0 2500.0
[1 values with dtype=int64]
- time(time)datetime64[ns]2012-01-01 ... 2019-08-31
- standard_name :
- time
- axis :
- T
array(['2012-01-01T00:00:00.000000000', '2012-01-02T00:00:00.000000000', '2012-01-03T00:00:00.000000000', ..., '2019-08-29T00:00:00.000000000', '2019-08-30T00:00:00.000000000', '2019-08-31T00:00:00.000000000'], dtype='datetime64[ns]') - spatial_ref()int64...
- crs_wkt :
- PROJCS["undefined",GEOGCS["undefined",DATUM["undefined",SPHEROID["undefined",6367470,0]],PRIMEM["Greenwich",0,AUTHORITY["EPSG","8901"]],UNIT["degree",0.0174532925199433]],PROJECTION["Lambert_Conformal_Conic_1SP"],PARAMETER["latitude_of_origin",53.5],PARAMETER["central_meridian",5],PARAMETER["scale_factor",1],PARAMETER["false_easting",1481641.67696368],PARAMETER["false_northing",537326.063885016],UNIT["metre",1,AUTHORITY["EPSG","9001"]],AXIS["Easting",EAST],AXIS["Northing",NORTH]]
- semi_major_axis :
- 6367470.0
- semi_minor_axis :
- 6367470.0
- inverse_flattening :
- 0.0
- reference_ellipsoid_name :
- undefined
- longitude_of_prime_meridian :
- 0.0
- prime_meridian_name :
- Greenwich
- geographic_crs_name :
- undefined
- horizontal_datum_name :
- undefined
- projected_crs_name :
- undefined
- grid_mapping_name :
- lambert_conformal_conic
- standard_parallel :
- 53.5
- longitude_of_central_meridian :
- 5.0
- false_easting :
- 1481641.67696368
- false_northing :
- 537326.063885016
- spatial_ref :
- PROJCS["undefined",GEOGCS["undefined",DATUM["undefined",SPHEROID["undefined",6367470,0]],PRIMEM["Greenwich",0,AUTHORITY["EPSG","8901"]],UNIT["degree",0.0174532925199433]],PROJECTION["Lambert_Conformal_Conic_1SP"],PARAMETER["latitude_of_origin",53.5],PARAMETER["central_meridian",5],PARAMETER["scale_factor",1],PARAMETER["false_easting",1481641.67696368],PARAMETER["false_northing",537326.063885016],UNIT["metre",1,AUTHORITY["EPSG","9001"]],AXIS["Easting",EAST],AXIS["Northing",NORTH]]
- GeoTransform :
- 413750.0 2500.0 0.0 406250.0 0.0 2500.0
[1 values with dtype=int64]
- nswrs(time, y, x)float32dask.array<chunksize=(2181, 127, 121), meta=np.ndarray>
- GRIB_paramId :
- 233253111
- GRIB_numberOfPoints :
- 258681
- GRIB_typeOfLevel :
- heightAboveGround
- GRIB_stepUnits :
- 1
- GRIB_stepType :
- accum
- GRIB_gridType :
- lambert
- GRIB_DxInMetres :
- 2500
- GRIB_DyInMetres :
- 2500
- GRIB_LaDInDegrees :
- 53.5
- GRIB_Latin1InDegrees :
- 53.5
- GRIB_Latin2InDegrees :
- 53.5
- GRIB_LoVInDegrees :
- 5.0
- GRIB_NV :
- 132
- GRIB_Nx :
- 529
- GRIB_Ny :
- 489
- GRIB_cfName :
- unknown
- GRIB_cfVarName :
- unknown
- GRIB_gridDefinitionDescription :
- Lambert Conformal
- GRIB_iScansNegatively :
- 0
- GRIB_jPointsAreConsecutive :
- 0
- GRIB_jScansPositively :
- 1
- GRIB_latitudeOfFirstGridPointInDegrees :
- 46.834
- GRIB_latitudeOfSouthernPoleInDegrees :
- 0.0
- GRIB_longitudeOfFirstGridPointInDegrees :
- -14.609
- GRIB_longitudeOfSouthernPoleInDegrees :
- 0.0
- GRIB_missingValue :
- 3.4028234663852886e+38
- GRIB_name :
- Net short-wave radiation flux (surface)
- GRIB_shortName :
- nswrs
- GRIB_units :
- W m**-2
- long_name :
- Net short-wave radiation flux (surface)
- units :
- MJ m⁻² day⁻¹
- standard_name :
- unknown
Array Chunk Bytes 280.15 MiB 127.85 MiB Shape (2800, 166, 158) (2181, 127, 121) Dask graph 8 chunks in 3 graph layers Data type float32 numpy.ndarray - grad(time, y, x)float32dask.array<chunksize=(2181, 127, 121), meta=np.ndarray>
Array Chunk Bytes 280.15 MiB 127.85 MiB Shape (2800, 166, 158) (2181, 127, 121) Dask graph 8 chunks in 4 graph layers Data type float32 numpy.ndarray
- xPandasIndex
PandasIndex(Float64Index([415000.0, 417500.0, 420000.0, 422500.0, 425000.0, 427500.0, 430000.0, 432500.0, 435000.0, 437500.0, ... 785000.0, 787500.0, 790000.0, 792500.0, 795000.0, 797500.0, 800000.0, 802500.0, 805000.0, 807500.0], dtype='float64', name='x', length=158)) - yPandasIndex
PandasIndex(Float64Index([407500.0, 410000.0, 412500.0, 415000.0, 417500.0, 420000.0, 422500.0, 425000.0, 427500.0, 430000.0, ... 797500.0, 800000.0, 802500.0, 805000.0, 807500.0, 810000.0, 812500.0, 815000.0, 817500.0, 820000.0], dtype='float64', name='y', length=166)) - timePandasIndex
PandasIndex(DatetimeIndex(['2012-01-01', '2012-01-02', '2012-01-03', '2012-01-04',
               '2012-01-05', '2012-01-06', '2012-01-07', '2012-01-08',
               '2012-01-09', '2012-01-10',
               ...
               '2019-08-22', '2019-08-23', '2019-08-24', '2019-08-25',
               '2019-08-26', '2019-08-27', '2019-08-28', '2019-08-29',
               '2019-08-30', '2019-08-31'],
              dtype='datetime64[ns]', name='time', length=2800, freq=None))
- CDI :
- Climate Data Interface version 2.0.5 (https://mpimet.mpg.de/cdi)
- Conventions :
- CF-1.6
- history :
- Fri Apr 14 14:07:36 2023: cdo -s -f nc4c -shifttime,-3hour -copy -seltimestep,3/744/3 /run/media/nms/Elements/MERA/grib/111_105_0_4_FC3hr/temp/MERA_PRODYEAR_2012_01_111_105_0_4_FC3hr /run/media/nms/Elements/MERA/grib/111_105_0_4_FC3hr/temp/MERA_PRODYEAR_2012_01_111_105_0_4_FC3hr.nc
- CDO :
- Climate Data Operators version 2.0.5 (https://mpimet.mpg.de/cdo)
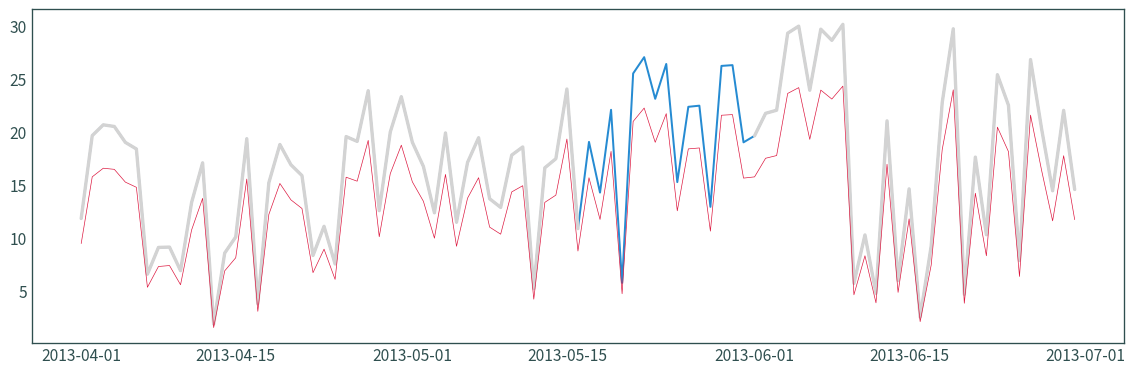
ds3 = ds3.fillna(ds2.assign(grad=ds2["nswrs"] * 1.2155399))
ds_ = ds.sel({"x": XLON, "y": YLAT}, method="nearest")
ds_ = ds_.sel(time=slice("2013-04", "2013-06"))
ds2_ = ds2.sel({"x": XLON, "y": YLAT}, method="nearest")
ds2_ = ds2_.sel(time=slice("2013-04", "2013-06"))
ds3_ = ds3.sel({"x": XLON, "y": YLAT}, method="nearest")
ds3_ = ds3_.sel(time=slice("2013-04", "2013-06"))
fig = plt.figure(figsize=(12, 4))
plt.plot(ds3_["time"], ds3_["grad"])
plt.plot(ds_["time"], ds_["grad"], color="lightgrey", linewidth=2.5)
plt.plot(ds2_["time"], ds2_["nswrs"], color="crimson", linewidth=0.5)

# plt.title(
#     data[var].attrs["long_name"] + " [" + data[var].attrs["units"] + "]"
# )
plt.tight_layout()
plt.show()