Met Éireann Reanalysis - create input data for ModVege#
import glob
import os
from datetime import datetime, timezone
import cartopy.crs as ccrs
import matplotlib.pyplot as plt
import pandas as pd
import xarray as xr
import climag.climag as cplt
from climag import climag_plot
# directory of processed MÉRA netCDF files
DATA_DIR = os.path.join("/run/media/nms/MyPassport", "MERA", "netcdf_day")
# list of netCDF variable files
var_list = [
    "11_105_2_0",  # 2 m temperature
    "61_105_0_4",  # total precipitation
    "117_105_0_4",  # global irradiance
    "PET",  # evapotranspiration
]
# dictionary to store Xarray datasets
ds = {}
for var in var_list:
    ds[var] = xr.open_mfdataset(
        glob.glob(os.path.join(DATA_DIR, f"MERA_{var}_day.nc")),
        chunks="auto",
        decode_coords="all",
    )
# obtain CRS info
data_crs = ds["11_105_2_0"].rio.crs
data_crs
CRS.from_wkt('PROJCS["undefined",GEOGCS["undefined",DATUM["undefined",SPHEROID["undefined",6367470,0]],PRIMEM["Greenwich",0,AUTHORITY["EPSG","8901"]],UNIT["degree",0.0174532925199433]],PROJECTION["Lambert_Conformal_Conic_1SP"],PARAMETER["latitude_of_origin",53.5],PARAMETER["central_meridian",5],PARAMETER["scale_factor",1],PARAMETER["false_easting",1481641.67696368],PARAMETER["false_northing",537326.063885016],UNIT["metre",1,AUTHORITY["EPSG","9001"]],AXIS["Easting",EAST],AXIS["Northing",NORTH]]')
# drop the height dimension from the datasets
for v in var_list[:-1]:
    ds[v] = ds[v].isel(height=0)
View datasets#
ds["11_105_2_0"]
<xarray.Dataset>
Dimensions:            (x: 158, y: 166, time: 9131)
Coordinates:
  * x                  (x) float64 4.15e+05 4.175e+05 ... 8.05e+05 8.075e+05
  * y                  (y) float64 4.075e+05 4.1e+05 ... 8.175e+05 8.2e+05
    height             float64 2.0
    Lambert_Conformal  int64 ...
  * time               (time) datetime64[ns] 1981-01-01 ... 2005-12-31
    spatial_ref        int64 ...
Data variables:
    t                  (time, y, x) float32 dask.array<chunksize=(4871, 85, 81), meta=np.ndarray>
Attributes:
    CDI:          Climate Data Interface version 2.0.5 (https://mpimet.mpg.de...
    Conventions:  CF-1.6
    history:      Wed Mar 22 19:51:04 2023: cdo -s -f nc4c -shifttime,-3hour ...
    CDO:          Climate Data Operators version 2.0.5 (https://mpimet.mpg.de...
xarray.Dataset
- x: 158
- y: 166
- time: 9131
- x(x)float644.15e+05 4.175e+05 ... 8.075e+05
- standard_name :
- projection_x_coordinate
- units :
- metre
- axis :
- X
- long_name :
- x coordinate of projection
array([415000., 417500., 420000., 422500., 425000., 427500., 430000., 432500., 435000., 437500., 440000., 442500., 445000., 447500., 450000., 452500., 455000., 457500., 460000., 462500., 465000., 467500., 470000., 472500., 475000., 477500., 480000., 482500., 485000., 487500., 490000., 492500., 495000., 497500., 500000., 502500., 505000., 507500., 510000., 512500., 515000., 517500., 520000., 522500., 525000., 527500., 530000., 532500., 535000., 537500., 540000., 542500., 545000., 547500., 550000., 552500., 555000., 557500., 560000., 562500., 565000., 567500., 570000., 572500., 575000., 577500., 580000., 582500., 585000., 587500., 590000., 592500., 595000., 597500., 600000., 602500., 605000., 607500., 610000., 612500., 615000., 617500., 620000., 622500., 625000., 627500., 630000., 632500., 635000., 637500., 640000., 642500., 645000., 647500., 650000., 652500., 655000., 657500., 660000., 662500., 665000., 667500., 670000., 672500., 675000., 677500., 680000., 682500., 685000., 687500., 690000., 692500., 695000., 697500., 700000., 702500., 705000., 707500., 710000., 712500., 715000., 717500., 720000., 722500., 725000., 727500., 730000., 732500., 735000., 737500., 740000., 742500., 745000., 747500., 750000., 752500., 755000., 757500., 760000., 762500., 765000., 767500., 770000., 772500., 775000., 777500., 780000., 782500., 785000., 787500., 790000., 792500., 795000., 797500., 800000., 802500., 805000., 807500.]) - y(y)float644.075e+05 4.1e+05 ... 8.2e+05
- standard_name :
- projection_y_coordinate
- units :
- metre
- axis :
- Y
- long_name :
- y coordinate of projection
array([407500., 410000., 412500., 415000., 417500., 420000., 422500., 425000., 427500., 430000., 432500., 435000., 437500., 440000., 442500., 445000., 447500., 450000., 452500., 455000., 457500., 460000., 462500., 465000., 467500., 470000., 472500., 475000., 477500., 480000., 482500., 485000., 487500., 490000., 492500., 495000., 497500., 500000., 502500., 505000., 507500., 510000., 512500., 515000., 517500., 520000., 522500., 525000., 527500., 530000., 532500., 535000., 537500., 540000., 542500., 545000., 547500., 550000., 552500., 555000., 557500., 560000., 562500., 565000., 567500., 570000., 572500., 575000., 577500., 580000., 582500., 585000., 587500., 590000., 592500., 595000., 597500., 600000., 602500., 605000., 607500., 610000., 612500., 615000., 617500., 620000., 622500., 625000., 627500., 630000., 632500., 635000., 637500., 640000., 642500., 645000., 647500., 650000., 652500., 655000., 657500., 660000., 662500., 665000., 667500., 670000., 672500., 675000., 677500., 680000., 682500., 685000., 687500., 690000., 692500., 695000., 697500., 700000., 702500., 705000., 707500., 710000., 712500., 715000., 717500., 720000., 722500., 725000., 727500., 730000., 732500., 735000., 737500., 740000., 742500., 745000., 747500., 750000., 752500., 755000., 757500., 760000., 762500., 765000., 767500., 770000., 772500., 775000., 777500., 780000., 782500., 785000., 787500., 790000., 792500., 795000., 797500., 800000., 802500., 805000., 807500., 810000., 812500., 815000., 817500., 820000.]) - height()float642.0
- standard_name :
- height
- long_name :
- height
- units :
- m
- positive :
- up
- axis :
- Z
array(2.)
- Lambert_Conformal()int64...
- crs_wkt :
- PROJCS["undefined",GEOGCS["undefined",DATUM["undefined",SPHEROID["undefined",6367470,0]],PRIMEM["Greenwich",0,AUTHORITY["EPSG","8901"]],UNIT["degree",0.0174532925199433]],PROJECTION["Lambert_Conformal_Conic_1SP"],PARAMETER["latitude_of_origin",53.5],PARAMETER["central_meridian",5],PARAMETER["scale_factor",1],PARAMETER["false_easting",1481641.67696368],PARAMETER["false_northing",537326.063885016],UNIT["metre",1,AUTHORITY["EPSG","9001"]],AXIS["Easting",EAST],AXIS["Northing",NORTH]]
- semi_major_axis :
- 6367470.0
- semi_minor_axis :
- 6367470.0
- inverse_flattening :
- 0.0
- reference_ellipsoid_name :
- undefined
- longitude_of_prime_meridian :
- 0.0
- prime_meridian_name :
- Greenwich
- geographic_crs_name :
- undefined
- horizontal_datum_name :
- undefined
- projected_crs_name :
- undefined
- grid_mapping_name :
- lambert_conformal_conic
- standard_parallel :
- 53.5
- longitude_of_central_meridian :
- 5.0
- false_easting :
- 1481641.67696368
- false_northing :
- 537326.063885016
- spatial_ref :
- PROJCS["undefined",GEOGCS["undefined",DATUM["undefined",SPHEROID["undefined",6367470,0]],PRIMEM["Greenwich",0,AUTHORITY["EPSG","8901"]],UNIT["degree",0.0174532925199433]],PROJECTION["Lambert_Conformal_Conic_1SP"],PARAMETER["latitude_of_origin",53.5],PARAMETER["central_meridian",5],PARAMETER["scale_factor",1],PARAMETER["false_easting",1481641.67696368],PARAMETER["false_northing",537326.063885016],UNIT["metre",1,AUTHORITY["EPSG","9001"]],AXIS["Easting",EAST],AXIS["Northing",NORTH]]
- GeoTransform :
- 413750.0 2500.0 0.0 406250.0 0.0 2500.0
[1 values with dtype=int64]
- time(time)datetime64[ns]1981-01-01 ... 2005-12-31
- standard_name :
- time
- axis :
- T
array(['1981-01-01T00:00:00.000000000', '1981-01-02T00:00:00.000000000', '1981-01-03T00:00:00.000000000', ..., '2005-12-29T00:00:00.000000000', '2005-12-30T00:00:00.000000000', '2005-12-31T00:00:00.000000000'], dtype='datetime64[ns]') - spatial_ref()int64...
- crs_wkt :
- PROJCS["undefined",GEOGCS["undefined",DATUM["undefined",SPHEROID["undefined",6367470,0]],PRIMEM["Greenwich",0,AUTHORITY["EPSG","8901"]],UNIT["degree",0.0174532925199433]],PROJECTION["Lambert_Conformal_Conic_1SP"],PARAMETER["latitude_of_origin",53.5],PARAMETER["central_meridian",5],PARAMETER["scale_factor",1],PARAMETER["false_easting",1481641.67696368],PARAMETER["false_northing",537326.063885016],UNIT["metre",1,AUTHORITY["EPSG","9001"]],AXIS["Easting",EAST],AXIS["Northing",NORTH]]
- semi_major_axis :
- 6367470.0
- semi_minor_axis :
- 6367470.0
- inverse_flattening :
- 0.0
- reference_ellipsoid_name :
- undefined
- longitude_of_prime_meridian :
- 0.0
- prime_meridian_name :
- Greenwich
- geographic_crs_name :
- undefined
- horizontal_datum_name :
- undefined
- projected_crs_name :
- undefined
- grid_mapping_name :
- lambert_conformal_conic
- standard_parallel :
- 53.5
- longitude_of_central_meridian :
- 5.0
- false_easting :
- 1481641.67696368
- false_northing :
- 537326.063885016
- spatial_ref :
- PROJCS["undefined",GEOGCS["undefined",DATUM["undefined",SPHEROID["undefined",6367470,0]],PRIMEM["Greenwich",0,AUTHORITY["EPSG","8901"]],UNIT["degree",0.0174532925199433]],PROJECTION["Lambert_Conformal_Conic_1SP"],PARAMETER["latitude_of_origin",53.5],PARAMETER["central_meridian",5],PARAMETER["scale_factor",1],PARAMETER["false_easting",1481641.67696368],PARAMETER["false_northing",537326.063885016],UNIT["metre",1,AUTHORITY["EPSG","9001"]],AXIS["Easting",EAST],AXIS["Northing",NORTH]]
- GeoTransform :
- 413750.0 2500.0 0.0 406250.0 0.0 2500.0
[1 values with dtype=int64]
- t(time, y, x)float32dask.array<chunksize=(4871, 85, 81), meta=np.ndarray>
- GRIB_paramId :
- 233253011
- GRIB_numberOfPoints :
- 258681
- GRIB_typeOfLevel :
- heightAboveGround
- GRIB_stepUnits :
- 1
- GRIB_stepType :
- instant
- GRIB_gridType :
- lambert
- GRIB_DxInMetres :
- 2500
- GRIB_DyInMetres :
- 2500
- GRIB_LaDInDegrees :
- 53.5
- GRIB_Latin1InDegrees :
- 53.5
- GRIB_Latin2InDegrees :
- 53.5
- GRIB_LoVInDegrees :
- 5.0
- GRIB_NV :
- 132
- GRIB_Nx :
- 529
- GRIB_Ny :
- 489
- GRIB_cfName :
- unknown
- GRIB_cfVarName :
- unknown
- GRIB_gridDefinitionDescription :
- Lambert Conformal
- GRIB_iScansNegatively :
- 0
- GRIB_jPointsAreConsecutive :
- 0
- GRIB_jScansPositively :
- 1
- GRIB_latitudeOfFirstGridPointInDegrees :
- 46.834
- GRIB_latitudeOfSouthernPoleInDegrees :
- 0.0
- GRIB_longitudeOfFirstGridPointInDegrees :
- -14.609
- GRIB_longitudeOfSouthernPoleInDegrees :
- 0.0
- GRIB_missingValue :
- 3.4028234663852886e+38
- GRIB_name :
- Temperature
- GRIB_shortName :
- t
- GRIB_units :
- K
- long_name :
- Temperature
- units :
- °C
- standard_name :
- unknown
Array Chunk Bytes 913.57 MiB 127.93 MiB Shape (9131, 166, 158) (4871, 85, 81) Dask graph 8 chunks in 3 graph layers Data type float32 numpy.ndarray
- xPandasIndex
PandasIndex(Float64Index([415000.0, 417500.0, 420000.0, 422500.0, 425000.0, 427500.0, 430000.0, 432500.0, 435000.0, 437500.0, ... 785000.0, 787500.0, 790000.0, 792500.0, 795000.0, 797500.0, 800000.0, 802500.0, 805000.0, 807500.0], dtype='float64', name='x', length=158)) - yPandasIndex
PandasIndex(Float64Index([407500.0, 410000.0, 412500.0, 415000.0, 417500.0, 420000.0, 422500.0, 425000.0, 427500.0, 430000.0, ... 797500.0, 800000.0, 802500.0, 805000.0, 807500.0, 810000.0, 812500.0, 815000.0, 817500.0, 820000.0], dtype='float64', name='y', length=166)) - timePandasIndex
PandasIndex(DatetimeIndex(['1981-01-01', '1981-01-02', '1981-01-03', '1981-01-04',
               '1981-01-05', '1981-01-06', '1981-01-07', '1981-01-08',
               '1981-01-09', '1981-01-10',
               ...
               '2005-12-22', '2005-12-23', '2005-12-24', '2005-12-25',
               '2005-12-26', '2005-12-27', '2005-12-28', '2005-12-29',
               '2005-12-30', '2005-12-31'],
              dtype='datetime64[ns]', name='time', length=9131, freq=None))
- CDI :
- Climate Data Interface version 2.0.5 (https://mpimet.mpg.de/cdi)
- Conventions :
- CF-1.6
- history :
- Wed Mar 22 19:51:04 2023: cdo -s -f nc4c -shifttime,-3hour -copy -seltimestep,3/744/3 /run/media/nms/Elements/MERA/grib/11_105_2_0_FC3hr/temp/MERA_PRODYEAR_1981_01_11_105_2_0_FC3hr /run/media/nms/Elements/MERA/grib/11_105_2_0_FC3hr/temp/MERA_PRODYEAR_1981_01_11_105_2_0_FC3hr.nc
- CDO :
- Climate Data Operators version 2.0.5 (https://mpimet.mpg.de/cdo)
ds["61_105_0_4"]
<xarray.Dataset>
Dimensions:            (x: 158, y: 166, time: 9131)
Coordinates:
  * x                  (x) float64 4.15e+05 4.175e+05 ... 8.05e+05 8.075e+05
  * y                  (y) float64 4.075e+05 4.1e+05 ... 8.175e+05 8.2e+05
    height             float64 0.0
    Lambert_Conformal  int64 ...
  * time               (time) datetime64[ns] 1981-01-01 ... 2005-12-31
    spatial_ref        int64 ...
Data variables:
    tp                 (time, y, x) float32 dask.array<chunksize=(4871, 85, 81), meta=np.ndarray>
Attributes:
    CDI:          Climate Data Interface version 2.0.5 (https://mpimet.mpg.de...
    Conventions:  CF-1.6
    history:      Wed Mar 22 16:41:24 2023: cdo -s -f nc4c -shifttime,-3hour ...
    CDO:          Climate Data Operators version 2.0.5 (https://mpimet.mpg.de...
xarray.Dataset
- x: 158
- y: 166
- time: 9131
- x(x)float644.15e+05 4.175e+05 ... 8.075e+05
- standard_name :
- projection_x_coordinate
- units :
- metre
- axis :
- X
- long_name :
- x coordinate of projection
array([415000., 417500., 420000., 422500., 425000., 427500., 430000., 432500., 435000., 437500., 440000., 442500., 445000., 447500., 450000., 452500., 455000., 457500., 460000., 462500., 465000., 467500., 470000., 472500., 475000., 477500., 480000., 482500., 485000., 487500., 490000., 492500., 495000., 497500., 500000., 502500., 505000., 507500., 510000., 512500., 515000., 517500., 520000., 522500., 525000., 527500., 530000., 532500., 535000., 537500., 540000., 542500., 545000., 547500., 550000., 552500., 555000., 557500., 560000., 562500., 565000., 567500., 570000., 572500., 575000., 577500., 580000., 582500., 585000., 587500., 590000., 592500., 595000., 597500., 600000., 602500., 605000., 607500., 610000., 612500., 615000., 617500., 620000., 622500., 625000., 627500., 630000., 632500., 635000., 637500., 640000., 642500., 645000., 647500., 650000., 652500., 655000., 657500., 660000., 662500., 665000., 667500., 670000., 672500., 675000., 677500., 680000., 682500., 685000., 687500., 690000., 692500., 695000., 697500., 700000., 702500., 705000., 707500., 710000., 712500., 715000., 717500., 720000., 722500., 725000., 727500., 730000., 732500., 735000., 737500., 740000., 742500., 745000., 747500., 750000., 752500., 755000., 757500., 760000., 762500., 765000., 767500., 770000., 772500., 775000., 777500., 780000., 782500., 785000., 787500., 790000., 792500., 795000., 797500., 800000., 802500., 805000., 807500.]) - y(y)float644.075e+05 4.1e+05 ... 8.2e+05
- standard_name :
- projection_y_coordinate
- units :
- metre
- axis :
- Y
- long_name :
- y coordinate of projection
array([407500., 410000., 412500., 415000., 417500., 420000., 422500., 425000., 427500., 430000., 432500., 435000., 437500., 440000., 442500., 445000., 447500., 450000., 452500., 455000., 457500., 460000., 462500., 465000., 467500., 470000., 472500., 475000., 477500., 480000., 482500., 485000., 487500., 490000., 492500., 495000., 497500., 500000., 502500., 505000., 507500., 510000., 512500., 515000., 517500., 520000., 522500., 525000., 527500., 530000., 532500., 535000., 537500., 540000., 542500., 545000., 547500., 550000., 552500., 555000., 557500., 560000., 562500., 565000., 567500., 570000., 572500., 575000., 577500., 580000., 582500., 585000., 587500., 590000., 592500., 595000., 597500., 600000., 602500., 605000., 607500., 610000., 612500., 615000., 617500., 620000., 622500., 625000., 627500., 630000., 632500., 635000., 637500., 640000., 642500., 645000., 647500., 650000., 652500., 655000., 657500., 660000., 662500., 665000., 667500., 670000., 672500., 675000., 677500., 680000., 682500., 685000., 687500., 690000., 692500., 695000., 697500., 700000., 702500., 705000., 707500., 710000., 712500., 715000., 717500., 720000., 722500., 725000., 727500., 730000., 732500., 735000., 737500., 740000., 742500., 745000., 747500., 750000., 752500., 755000., 757500., 760000., 762500., 765000., 767500., 770000., 772500., 775000., 777500., 780000., 782500., 785000., 787500., 790000., 792500., 795000., 797500., 800000., 802500., 805000., 807500., 810000., 812500., 815000., 817500., 820000.]) - height()float640.0
- standard_name :
- height
- long_name :
- height
- units :
- m
- positive :
- up
- axis :
- Z
array(0.)
- Lambert_Conformal()int64...
- crs_wkt :
- PROJCS["undefined",GEOGCS["undefined",DATUM["undefined",SPHEROID["undefined",6367470,0]],PRIMEM["Greenwich",0,AUTHORITY["EPSG","8901"]],UNIT["degree",0.0174532925199433]],PROJECTION["Lambert_Conformal_Conic_1SP"],PARAMETER["latitude_of_origin",53.5],PARAMETER["central_meridian",5],PARAMETER["scale_factor",1],PARAMETER["false_easting",1481641.67696368],PARAMETER["false_northing",537326.063885016],UNIT["metre",1,AUTHORITY["EPSG","9001"]],AXIS["Easting",EAST],AXIS["Northing",NORTH]]
- semi_major_axis :
- 6367470.0
- semi_minor_axis :
- 6367470.0
- inverse_flattening :
- 0.0
- reference_ellipsoid_name :
- undefined
- longitude_of_prime_meridian :
- 0.0
- prime_meridian_name :
- Greenwich
- geographic_crs_name :
- undefined
- horizontal_datum_name :
- undefined
- projected_crs_name :
- undefined
- grid_mapping_name :
- lambert_conformal_conic
- standard_parallel :
- 53.5
- longitude_of_central_meridian :
- 5.0
- false_easting :
- 1481641.67696368
- false_northing :
- 537326.063885016
- spatial_ref :
- PROJCS["undefined",GEOGCS["undefined",DATUM["undefined",SPHEROID["undefined",6367470,0]],PRIMEM["Greenwich",0,AUTHORITY["EPSG","8901"]],UNIT["degree",0.0174532925199433]],PROJECTION["Lambert_Conformal_Conic_1SP"],PARAMETER["latitude_of_origin",53.5],PARAMETER["central_meridian",5],PARAMETER["scale_factor",1],PARAMETER["false_easting",1481641.67696368],PARAMETER["false_northing",537326.063885016],UNIT["metre",1,AUTHORITY["EPSG","9001"]],AXIS["Easting",EAST],AXIS["Northing",NORTH]]
- GeoTransform :
- 413750.0 2500.0 0.0 406250.0 0.0 2500.0
[1 values with dtype=int64]
- time(time)datetime64[ns]1981-01-01 ... 2005-12-31
- standard_name :
- time
- axis :
- T
array(['1981-01-01T00:00:00.000000000', '1981-01-02T00:00:00.000000000', '1981-01-03T00:00:00.000000000', ..., '2005-12-29T00:00:00.000000000', '2005-12-30T00:00:00.000000000', '2005-12-31T00:00:00.000000000'], dtype='datetime64[ns]') - spatial_ref()int64...
- crs_wkt :
- PROJCS["undefined",GEOGCS["undefined",DATUM["undefined",SPHEROID["undefined",6367470,0]],PRIMEM["Greenwich",0,AUTHORITY["EPSG","8901"]],UNIT["degree",0.0174532925199433]],PROJECTION["Lambert_Conformal_Conic_1SP"],PARAMETER["latitude_of_origin",53.5],PARAMETER["central_meridian",5],PARAMETER["scale_factor",1],PARAMETER["false_easting",1481641.67696368],PARAMETER["false_northing",537326.063885016],UNIT["metre",1,AUTHORITY["EPSG","9001"]],AXIS["Easting",EAST],AXIS["Northing",NORTH]]
- semi_major_axis :
- 6367470.0
- semi_minor_axis :
- 6367470.0
- inverse_flattening :
- 0.0
- reference_ellipsoid_name :
- undefined
- longitude_of_prime_meridian :
- 0.0
- prime_meridian_name :
- Greenwich
- geographic_crs_name :
- undefined
- horizontal_datum_name :
- undefined
- projected_crs_name :
- undefined
- grid_mapping_name :
- lambert_conformal_conic
- standard_parallel :
- 53.5
- longitude_of_central_meridian :
- 5.0
- false_easting :
- 1481641.67696368
- false_northing :
- 537326.063885016
- spatial_ref :
- PROJCS["undefined",GEOGCS["undefined",DATUM["undefined",SPHEROID["undefined",6367470,0]],PRIMEM["Greenwich",0,AUTHORITY["EPSG","8901"]],UNIT["degree",0.0174532925199433]],PROJECTION["Lambert_Conformal_Conic_1SP"],PARAMETER["latitude_of_origin",53.5],PARAMETER["central_meridian",5],PARAMETER["scale_factor",1],PARAMETER["false_easting",1481641.67696368],PARAMETER["false_northing",537326.063885016],UNIT["metre",1,AUTHORITY["EPSG","9001"]],AXIS["Easting",EAST],AXIS["Northing",NORTH]]
- GeoTransform :
- 413750.0 2500.0 0.0 406250.0 0.0 2500.0
[1 values with dtype=int64]
- tp(time, y, x)float32dask.array<chunksize=(4871, 85, 81), meta=np.ndarray>
- GRIB_paramId :
- 233253061
- GRIB_numberOfPoints :
- 258681
- GRIB_typeOfLevel :
- heightAboveGround
- GRIB_stepUnits :
- 1
- GRIB_stepType :
- accum
- GRIB_gridType :
- lambert
- GRIB_DxInMetres :
- 2500
- GRIB_DyInMetres :
- 2500
- GRIB_LaDInDegrees :
- 53.5
- GRIB_Latin1InDegrees :
- 53.5
- GRIB_Latin2InDegrees :
- 53.5
- GRIB_LoVInDegrees :
- 5.0
- GRIB_NV :
- 132
- GRIB_Nx :
- 529
- GRIB_Ny :
- 489
- GRIB_cfName :
- unknown
- GRIB_cfVarName :
- unknown
- GRIB_gridDefinitionDescription :
- Lambert Conformal
- GRIB_iScansNegatively :
- 0
- GRIB_jPointsAreConsecutive :
- 0
- GRIB_jScansPositively :
- 1
- GRIB_latitudeOfFirstGridPointInDegrees :
- 46.834
- GRIB_latitudeOfSouthernPoleInDegrees :
- 0.0
- GRIB_longitudeOfFirstGridPointInDegrees :
- -14.609
- GRIB_longitudeOfSouthernPoleInDegrees :
- 0.0
- GRIB_missingValue :
- 3.4028234663852886e+38
- GRIB_name :
- Total precipitation
- GRIB_shortName :
- tp
- GRIB_units :
- kg m**-2
- long_name :
- Total precipitation
- units :
- mm day⁻¹
- standard_name :
- unknown
Array Chunk Bytes 913.57 MiB 127.93 MiB Shape (9131, 166, 158) (4871, 85, 81) Dask graph 8 chunks in 3 graph layers Data type float32 numpy.ndarray
- xPandasIndex
PandasIndex(Float64Index([415000.0, 417500.0, 420000.0, 422500.0, 425000.0, 427500.0, 430000.0, 432500.0, 435000.0, 437500.0, ... 785000.0, 787500.0, 790000.0, 792500.0, 795000.0, 797500.0, 800000.0, 802500.0, 805000.0, 807500.0], dtype='float64', name='x', length=158)) - yPandasIndex
PandasIndex(Float64Index([407500.0, 410000.0, 412500.0, 415000.0, 417500.0, 420000.0, 422500.0, 425000.0, 427500.0, 430000.0, ... 797500.0, 800000.0, 802500.0, 805000.0, 807500.0, 810000.0, 812500.0, 815000.0, 817500.0, 820000.0], dtype='float64', name='y', length=166)) - timePandasIndex
PandasIndex(DatetimeIndex(['1981-01-01', '1981-01-02', '1981-01-03', '1981-01-04',
               '1981-01-05', '1981-01-06', '1981-01-07', '1981-01-08',
               '1981-01-09', '1981-01-10',
               ...
               '2005-12-22', '2005-12-23', '2005-12-24', '2005-12-25',
               '2005-12-26', '2005-12-27', '2005-12-28', '2005-12-29',
               '2005-12-30', '2005-12-31'],
              dtype='datetime64[ns]', name='time', length=9131, freq=None))
- CDI :
- Climate Data Interface version 2.0.5 (https://mpimet.mpg.de/cdi)
- Conventions :
- CF-1.6
- history :
- Wed Mar 22 16:41:24 2023: cdo -s -f nc4c -shifttime,-3hour -copy -seltimestep,3/744/3 /run/media/nms/Elements/MERA/grib/61_105_0_4_FC3hr/temp/MERA_PRODYEAR_1981_01_61_105_0_4_FC3hr /run/media/nms/Elements/MERA/grib/61_105_0_4_FC3hr/temp/MERA_PRODYEAR_1981_01_61_105_0_4_FC3hr.nc
- CDO :
- Climate Data Operators version 2.0.5 (https://mpimet.mpg.de/cdo)
ds["117_105_0_4"]
<xarray.Dataset>
Dimensions:            (x: 158, y: 166, time: 9131)
Coordinates:
  * x                  (x) float64 4.15e+05 4.175e+05 ... 8.05e+05 8.075e+05
  * y                  (y) float64 4.075e+05 4.1e+05 ... 8.175e+05 8.2e+05
    height             float64 0.0
    Lambert_Conformal  int64 ...
  * time               (time) datetime64[ns] 1981-01-01 ... 2005-12-31
    spatial_ref        int64 ...
Data variables:
    grad               (time, y, x) float32 dask.array<chunksize=(4871, 85, 81), meta=np.ndarray>
Attributes:
    CDI:          Climate Data Interface version 2.0.5 (https://mpimet.mpg.de...
    Conventions:  CF-1.6
    history:      Wed Mar 22 21:11:40 2023: cdo -s -f nc4c -shifttime,-3hour ...
    CDO:          Climate Data Operators version 2.0.5 (https://mpimet.mpg.de...
xarray.Dataset
- x: 158
- y: 166
- time: 9131
- x(x)float644.15e+05 4.175e+05 ... 8.075e+05
- standard_name :
- projection_x_coordinate
- units :
- metre
- axis :
- X
- long_name :
- x coordinate of projection
array([415000., 417500., 420000., 422500., 425000., 427500., 430000., 432500., 435000., 437500., 440000., 442500., 445000., 447500., 450000., 452500., 455000., 457500., 460000., 462500., 465000., 467500., 470000., 472500., 475000., 477500., 480000., 482500., 485000., 487500., 490000., 492500., 495000., 497500., 500000., 502500., 505000., 507500., 510000., 512500., 515000., 517500., 520000., 522500., 525000., 527500., 530000., 532500., 535000., 537500., 540000., 542500., 545000., 547500., 550000., 552500., 555000., 557500., 560000., 562500., 565000., 567500., 570000., 572500., 575000., 577500., 580000., 582500., 585000., 587500., 590000., 592500., 595000., 597500., 600000., 602500., 605000., 607500., 610000., 612500., 615000., 617500., 620000., 622500., 625000., 627500., 630000., 632500., 635000., 637500., 640000., 642500., 645000., 647500., 650000., 652500., 655000., 657500., 660000., 662500., 665000., 667500., 670000., 672500., 675000., 677500., 680000., 682500., 685000., 687500., 690000., 692500., 695000., 697500., 700000., 702500., 705000., 707500., 710000., 712500., 715000., 717500., 720000., 722500., 725000., 727500., 730000., 732500., 735000., 737500., 740000., 742500., 745000., 747500., 750000., 752500., 755000., 757500., 760000., 762500., 765000., 767500., 770000., 772500., 775000., 777500., 780000., 782500., 785000., 787500., 790000., 792500., 795000., 797500., 800000., 802500., 805000., 807500.]) - y(y)float644.075e+05 4.1e+05 ... 8.2e+05
- standard_name :
- projection_y_coordinate
- units :
- metre
- axis :
- Y
- long_name :
- y coordinate of projection
array([407500., 410000., 412500., 415000., 417500., 420000., 422500., 425000., 427500., 430000., 432500., 435000., 437500., 440000., 442500., 445000., 447500., 450000., 452500., 455000., 457500., 460000., 462500., 465000., 467500., 470000., 472500., 475000., 477500., 480000., 482500., 485000., 487500., 490000., 492500., 495000., 497500., 500000., 502500., 505000., 507500., 510000., 512500., 515000., 517500., 520000., 522500., 525000., 527500., 530000., 532500., 535000., 537500., 540000., 542500., 545000., 547500., 550000., 552500., 555000., 557500., 560000., 562500., 565000., 567500., 570000., 572500., 575000., 577500., 580000., 582500., 585000., 587500., 590000., 592500., 595000., 597500., 600000., 602500., 605000., 607500., 610000., 612500., 615000., 617500., 620000., 622500., 625000., 627500., 630000., 632500., 635000., 637500., 640000., 642500., 645000., 647500., 650000., 652500., 655000., 657500., 660000., 662500., 665000., 667500., 670000., 672500., 675000., 677500., 680000., 682500., 685000., 687500., 690000., 692500., 695000., 697500., 700000., 702500., 705000., 707500., 710000., 712500., 715000., 717500., 720000., 722500., 725000., 727500., 730000., 732500., 735000., 737500., 740000., 742500., 745000., 747500., 750000., 752500., 755000., 757500., 760000., 762500., 765000., 767500., 770000., 772500., 775000., 777500., 780000., 782500., 785000., 787500., 790000., 792500., 795000., 797500., 800000., 802500., 805000., 807500., 810000., 812500., 815000., 817500., 820000.]) - height()float640.0
- standard_name :
- height
- long_name :
- height
- units :
- m
- positive :
- up
- axis :
- Z
array(0.)
- Lambert_Conformal()int64...
- crs_wkt :
- PROJCS["undefined",GEOGCS["undefined",DATUM["undefined",SPHEROID["undefined",6367470,0]],PRIMEM["Greenwich",0,AUTHORITY["EPSG","8901"]],UNIT["degree",0.0174532925199433]],PROJECTION["Lambert_Conformal_Conic_1SP"],PARAMETER["latitude_of_origin",53.5],PARAMETER["central_meridian",5],PARAMETER["scale_factor",1],PARAMETER["false_easting",1481641.67696368],PARAMETER["false_northing",537326.063885016],UNIT["metre",1,AUTHORITY["EPSG","9001"]],AXIS["Easting",EAST],AXIS["Northing",NORTH]]
- semi_major_axis :
- 6367470.0
- semi_minor_axis :
- 6367470.0
- inverse_flattening :
- 0.0
- reference_ellipsoid_name :
- undefined
- longitude_of_prime_meridian :
- 0.0
- prime_meridian_name :
- Greenwich
- geographic_crs_name :
- undefined
- horizontal_datum_name :
- undefined
- projected_crs_name :
- undefined
- grid_mapping_name :
- lambert_conformal_conic
- standard_parallel :
- 53.5
- longitude_of_central_meridian :
- 5.0
- false_easting :
- 1481641.67696368
- false_northing :
- 537326.063885016
- spatial_ref :
- PROJCS["undefined",GEOGCS["undefined",DATUM["undefined",SPHEROID["undefined",6367470,0]],PRIMEM["Greenwich",0,AUTHORITY["EPSG","8901"]],UNIT["degree",0.0174532925199433]],PROJECTION["Lambert_Conformal_Conic_1SP"],PARAMETER["latitude_of_origin",53.5],PARAMETER["central_meridian",5],PARAMETER["scale_factor",1],PARAMETER["false_easting",1481641.67696368],PARAMETER["false_northing",537326.063885016],UNIT["metre",1,AUTHORITY["EPSG","9001"]],AXIS["Easting",EAST],AXIS["Northing",NORTH]]
- GeoTransform :
- 413750.0 2500.0 0.0 406250.0 0.0 2500.0
[1 values with dtype=int64]
- time(time)datetime64[ns]1981-01-01 ... 2005-12-31
- standard_name :
- time
- axis :
- T
array(['1981-01-01T00:00:00.000000000', '1981-01-02T00:00:00.000000000', '1981-01-03T00:00:00.000000000', ..., '2005-12-29T00:00:00.000000000', '2005-12-30T00:00:00.000000000', '2005-12-31T00:00:00.000000000'], dtype='datetime64[ns]') - spatial_ref()int64...
- crs_wkt :
- PROJCS["undefined",GEOGCS["undefined",DATUM["undefined",SPHEROID["undefined",6367470,0]],PRIMEM["Greenwich",0,AUTHORITY["EPSG","8901"]],UNIT["degree",0.0174532925199433]],PROJECTION["Lambert_Conformal_Conic_1SP"],PARAMETER["latitude_of_origin",53.5],PARAMETER["central_meridian",5],PARAMETER["scale_factor",1],PARAMETER["false_easting",1481641.67696368],PARAMETER["false_northing",537326.063885016],UNIT["metre",1,AUTHORITY["EPSG","9001"]],AXIS["Easting",EAST],AXIS["Northing",NORTH]]
- semi_major_axis :
- 6367470.0
- semi_minor_axis :
- 6367470.0
- inverse_flattening :
- 0.0
- reference_ellipsoid_name :
- undefined
- longitude_of_prime_meridian :
- 0.0
- prime_meridian_name :
- Greenwich
- geographic_crs_name :
- undefined
- horizontal_datum_name :
- undefined
- projected_crs_name :
- undefined
- grid_mapping_name :
- lambert_conformal_conic
- standard_parallel :
- 53.5
- longitude_of_central_meridian :
- 5.0
- false_easting :
- 1481641.67696368
- false_northing :
- 537326.063885016
- spatial_ref :
- PROJCS["undefined",GEOGCS["undefined",DATUM["undefined",SPHEROID["undefined",6367470,0]],PRIMEM["Greenwich",0,AUTHORITY["EPSG","8901"]],UNIT["degree",0.0174532925199433]],PROJECTION["Lambert_Conformal_Conic_1SP"],PARAMETER["latitude_of_origin",53.5],PARAMETER["central_meridian",5],PARAMETER["scale_factor",1],PARAMETER["false_easting",1481641.67696368],PARAMETER["false_northing",537326.063885016],UNIT["metre",1,AUTHORITY["EPSG","9001"]],AXIS["Easting",EAST],AXIS["Northing",NORTH]]
- GeoTransform :
- 413750.0 2500.0 0.0 406250.0 0.0 2500.0
[1 values with dtype=int64]
- grad(time, y, x)float32dask.array<chunksize=(4871, 85, 81), meta=np.ndarray>
- GRIB_paramId :
- 233253117
- GRIB_numberOfPoints :
- 258681
- GRIB_typeOfLevel :
- heightAboveGround
- GRIB_stepUnits :
- 1
- GRIB_stepType :
- accum
- GRIB_gridType :
- lambert
- GRIB_DxInMetres :
- 2500
- GRIB_DyInMetres :
- 2500
- GRIB_LaDInDegrees :
- 53.5
- GRIB_Latin1InDegrees :
- 53.5
- GRIB_Latin2InDegrees :
- 53.5
- GRIB_LoVInDegrees :
- 5.0
- GRIB_NV :
- 132
- GRIB_Nx :
- 529
- GRIB_Ny :
- 489
- GRIB_cfName :
- unknown
- GRIB_cfVarName :
- unknown
- GRIB_gridDefinitionDescription :
- Lambert Conformal
- GRIB_iScansNegatively :
- 0
- GRIB_jPointsAreConsecutive :
- 0
- GRIB_jScansPositively :
- 1
- GRIB_latitudeOfFirstGridPointInDegrees :
- 46.834
- GRIB_latitudeOfSouthernPoleInDegrees :
- 0.0
- GRIB_longitudeOfFirstGridPointInDegrees :
- -14.609
- GRIB_longitudeOfSouthernPoleInDegrees :
- 0.0
- GRIB_missingValue :
- 3.4028234663852886e+38
- GRIB_name :
- Global radiation flux
- GRIB_shortName :
- grad
- GRIB_units :
- W m**-2
- long_name :
- Global radiation flux
- units :
- MJ m⁻² day⁻¹
- standard_name :
- unknown
Array Chunk Bytes 913.57 MiB 127.93 MiB Shape (9131, 166, 158) (4871, 85, 81) Dask graph 8 chunks in 3 graph layers Data type float32 numpy.ndarray
- xPandasIndex
PandasIndex(Float64Index([415000.0, 417500.0, 420000.0, 422500.0, 425000.0, 427500.0, 430000.0, 432500.0, 435000.0, 437500.0, ... 785000.0, 787500.0, 790000.0, 792500.0, 795000.0, 797500.0, 800000.0, 802500.0, 805000.0, 807500.0], dtype='float64', name='x', length=158)) - yPandasIndex
PandasIndex(Float64Index([407500.0, 410000.0, 412500.0, 415000.0, 417500.0, 420000.0, 422500.0, 425000.0, 427500.0, 430000.0, ... 797500.0, 800000.0, 802500.0, 805000.0, 807500.0, 810000.0, 812500.0, 815000.0, 817500.0, 820000.0], dtype='float64', name='y', length=166)) - timePandasIndex
PandasIndex(DatetimeIndex(['1981-01-01', '1981-01-02', '1981-01-03', '1981-01-04',
               '1981-01-05', '1981-01-06', '1981-01-07', '1981-01-08',
               '1981-01-09', '1981-01-10',
               ...
               '2005-12-22', '2005-12-23', '2005-12-24', '2005-12-25',
               '2005-12-26', '2005-12-27', '2005-12-28', '2005-12-29',
               '2005-12-30', '2005-12-31'],
              dtype='datetime64[ns]', name='time', length=9131, freq=None))
- CDI :
- Climate Data Interface version 2.0.5 (https://mpimet.mpg.de/cdi)
- Conventions :
- CF-1.6
- history :
- Wed Mar 22 21:11:40 2023: cdo -s -f nc4c -shifttime,-3hour -copy -seltimestep,3/744/3 /run/media/nms/Elements/MERA/grib/117_105_0_4_FC3hr/temp/MERA_PRODYEAR_1981_01_117_105_0_4_FC3hr /run/media/nms/Elements/MERA/grib/117_105_0_4_FC3hr/temp/MERA_PRODYEAR_1981_01_117_105_0_4_FC3hr.nc
- CDO :
- Climate Data Operators version 2.0.5 (https://mpimet.mpg.de/cdo)
ds["PET"]
<xarray.Dataset>
Dimensions:            (x: 158, y: 166, time: 9131)
Coordinates:
  * x                  (x) float64 4.15e+05 4.175e+05 ... 8.05e+05 8.075e+05
  * y                  (y) float64 4.075e+05 4.1e+05 ... 8.175e+05 8.2e+05
    height             float64 ...
    Lambert_Conformal  int64 ...
  * time               (time) datetime64[ns] 1981-01-01 ... 2005-12-31
    spatial_ref        int64 ...
Data variables:
    PET                (time, y, x) float32 dask.array<chunksize=(4756, 86, 82), meta=np.ndarray>
Attributes:
    CDI:          Climate Data Interface version 2.0.5 (https://mpimet.mpg.de...
    Conventions:  CF-1.6
    CDO:          Climate Data Operators version 2.0.5 (https://mpimet.mpg.de...
xarray.Dataset
- x: 158
- y: 166
- time: 9131
- x(x)float644.15e+05 4.175e+05 ... 8.075e+05
- standard_name :
- projection_x_coordinate
- units :
- metre
- axis :
- X
- long_name :
- x coordinate of projection
array([415000., 417500., 420000., 422500., 425000., 427500., 430000., 432500., 435000., 437500., 440000., 442500., 445000., 447500., 450000., 452500., 455000., 457500., 460000., 462500., 465000., 467500., 470000., 472500., 475000., 477500., 480000., 482500., 485000., 487500., 490000., 492500., 495000., 497500., 500000., 502500., 505000., 507500., 510000., 512500., 515000., 517500., 520000., 522500., 525000., 527500., 530000., 532500., 535000., 537500., 540000., 542500., 545000., 547500., 550000., 552500., 555000., 557500., 560000., 562500., 565000., 567500., 570000., 572500., 575000., 577500., 580000., 582500., 585000., 587500., 590000., 592500., 595000., 597500., 600000., 602500., 605000., 607500., 610000., 612500., 615000., 617500., 620000., 622500., 625000., 627500., 630000., 632500., 635000., 637500., 640000., 642500., 645000., 647500., 650000., 652500., 655000., 657500., 660000., 662500., 665000., 667500., 670000., 672500., 675000., 677500., 680000., 682500., 685000., 687500., 690000., 692500., 695000., 697500., 700000., 702500., 705000., 707500., 710000., 712500., 715000., 717500., 720000., 722500., 725000., 727500., 730000., 732500., 735000., 737500., 740000., 742500., 745000., 747500., 750000., 752500., 755000., 757500., 760000., 762500., 765000., 767500., 770000., 772500., 775000., 777500., 780000., 782500., 785000., 787500., 790000., 792500., 795000., 797500., 800000., 802500., 805000., 807500.]) - y(y)float644.075e+05 4.1e+05 ... 8.2e+05
- standard_name :
- projection_y_coordinate
- units :
- metre
- axis :
- Y
- long_name :
- y coordinate of projection
array([407500., 410000., 412500., 415000., 417500., 420000., 422500., 425000., 427500., 430000., 432500., 435000., 437500., 440000., 442500., 445000., 447500., 450000., 452500., 455000., 457500., 460000., 462500., 465000., 467500., 470000., 472500., 475000., 477500., 480000., 482500., 485000., 487500., 490000., 492500., 495000., 497500., 500000., 502500., 505000., 507500., 510000., 512500., 515000., 517500., 520000., 522500., 525000., 527500., 530000., 532500., 535000., 537500., 540000., 542500., 545000., 547500., 550000., 552500., 555000., 557500., 560000., 562500., 565000., 567500., 570000., 572500., 575000., 577500., 580000., 582500., 585000., 587500., 590000., 592500., 595000., 597500., 600000., 602500., 605000., 607500., 610000., 612500., 615000., 617500., 620000., 622500., 625000., 627500., 630000., 632500., 635000., 637500., 640000., 642500., 645000., 647500., 650000., 652500., 655000., 657500., 660000., 662500., 665000., 667500., 670000., 672500., 675000., 677500., 680000., 682500., 685000., 687500., 690000., 692500., 695000., 697500., 700000., 702500., 705000., 707500., 710000., 712500., 715000., 717500., 720000., 722500., 725000., 727500., 730000., 732500., 735000., 737500., 740000., 742500., 745000., 747500., 750000., 752500., 755000., 757500., 760000., 762500., 765000., 767500., 770000., 772500., 775000., 777500., 780000., 782500., 785000., 787500., 790000., 792500., 795000., 797500., 800000., 802500., 805000., 807500., 810000., 812500., 815000., 817500., 820000.]) - height()float64...
- standard_name :
- height
- long_name :
- height
- units :
- m
- positive :
- up
- axis :
- Z
[1 values with dtype=float64]
- Lambert_Conformal()int64...
- crs_wkt :
- PROJCS["undefined",GEOGCS["undefined",DATUM["undefined",SPHEROID["undefined",6367470,0]],PRIMEM["Greenwich",0,AUTHORITY["EPSG","8901"]],UNIT["degree",0.0174532925199433]],PROJECTION["Lambert_Conformal_Conic_1SP"],PARAMETER["latitude_of_origin",53.5],PARAMETER["central_meridian",5],PARAMETER["scale_factor",1],PARAMETER["false_easting",1481641.67696368],PARAMETER["false_northing",537326.063885016],UNIT["metre",1,AUTHORITY["EPSG","9001"]],AXIS["Easting",EAST],AXIS["Northing",NORTH]]
- semi_major_axis :
- 6367470.0
- semi_minor_axis :
- 6367470.0
- inverse_flattening :
- 0.0
- reference_ellipsoid_name :
- undefined
- longitude_of_prime_meridian :
- 0.0
- prime_meridian_name :
- Greenwich
- geographic_crs_name :
- undefined
- horizontal_datum_name :
- undefined
- projected_crs_name :
- undefined
- grid_mapping_name :
- lambert_conformal_conic
- standard_parallel :
- 53.5
- longitude_of_central_meridian :
- 5.0
- false_easting :
- 1481641.67696368
- false_northing :
- 537326.063885016
- spatial_ref :
- PROJCS["undefined",GEOGCS["undefined",DATUM["undefined",SPHEROID["undefined",6367470,0]],PRIMEM["Greenwich",0,AUTHORITY["EPSG","8901"]],UNIT["degree",0.0174532925199433]],PROJECTION["Lambert_Conformal_Conic_1SP"],PARAMETER["latitude_of_origin",53.5],PARAMETER["central_meridian",5],PARAMETER["scale_factor",1],PARAMETER["false_easting",1481641.67696368],PARAMETER["false_northing",537326.063885016],UNIT["metre",1,AUTHORITY["EPSG","9001"]],AXIS["Easting",EAST],AXIS["Northing",NORTH]]
- GeoTransform :
- 413750.0 2500.0 0.0 406250.0 0.0 2500.0
[1 values with dtype=int64]
- time(time)datetime64[ns]1981-01-01 ... 2005-12-31
- standard_name :
- time
- axis :
- T
array(['1981-01-01T00:00:00.000000000', '1981-01-02T00:00:00.000000000', '1981-01-03T00:00:00.000000000', ..., '2005-12-29T00:00:00.000000000', '2005-12-30T00:00:00.000000000', '2005-12-31T00:00:00.000000000'], dtype='datetime64[ns]') - spatial_ref()int64...
- crs_wkt :
- PROJCS["undefined",GEOGCS["undefined",DATUM["undefined",SPHEROID["undefined",6367470,0]],PRIMEM["Greenwich",0,AUTHORITY["EPSG","8901"]],UNIT["degree",0.0174532925199433]],PROJECTION["Lambert_Conformal_Conic_1SP"],PARAMETER["latitude_of_origin",53.5],PARAMETER["central_meridian",5],PARAMETER["scale_factor",1],PARAMETER["false_easting",1481641.67696368],PARAMETER["false_northing",537326.063885016],UNIT["metre",1,AUTHORITY["EPSG","9001"]],AXIS["Easting",EAST],AXIS["Northing",NORTH]]
- semi_major_axis :
- 6367470.0
- semi_minor_axis :
- 6367470.0
- inverse_flattening :
- 0.0
- reference_ellipsoid_name :
- undefined
- longitude_of_prime_meridian :
- 0.0
- prime_meridian_name :
- Greenwich
- geographic_crs_name :
- undefined
- horizontal_datum_name :
- undefined
- projected_crs_name :
- undefined
- grid_mapping_name :
- lambert_conformal_conic
- standard_parallel :
- 53.5
- longitude_of_central_meridian :
- 5.0
- false_easting :
- 1481641.67696368
- false_northing :
- 537326.063885016
- spatial_ref :
- PROJCS["undefined",GEOGCS["undefined",DATUM["undefined",SPHEROID["undefined",6367470,0]],PRIMEM["Greenwich",0,AUTHORITY["EPSG","8901"]],UNIT["degree",0.0174532925199433]],PROJECTION["Lambert_Conformal_Conic_1SP"],PARAMETER["latitude_of_origin",53.5],PARAMETER["central_meridian",5],PARAMETER["scale_factor",1],PARAMETER["false_easting",1481641.67696368],PARAMETER["false_northing",537326.063885016],UNIT["metre",1,AUTHORITY["EPSG","9001"]],AXIS["Easting",EAST],AXIS["Northing",NORTH]]
- GeoTransform :
- 413750.0 2500.0 0.0 406250.0 0.0 2500.0
[1 values with dtype=int64]
- PET(time, y, x)float32dask.array<chunksize=(4756, 86, 82), meta=np.ndarray>
- units :
- mm day⁻¹
- long_name :
- Reference evapotranspiration
Array Chunk Bytes 913.57 MiB 127.94 MiB Shape (9131, 166, 158) (4756, 86, 82) Dask graph 8 chunks in 2 graph layers Data type float32 numpy.ndarray
- xPandasIndex
PandasIndex(Float64Index([415000.0, 417500.0, 420000.0, 422500.0, 425000.0, 427500.0, 430000.0, 432500.0, 435000.0, 437500.0, ... 785000.0, 787500.0, 790000.0, 792500.0, 795000.0, 797500.0, 800000.0, 802500.0, 805000.0, 807500.0], dtype='float64', name='x', length=158)) - yPandasIndex
PandasIndex(Float64Index([407500.0, 410000.0, 412500.0, 415000.0, 417500.0, 420000.0, 422500.0, 425000.0, 427500.0, 430000.0, ... 797500.0, 800000.0, 802500.0, 805000.0, 807500.0, 810000.0, 812500.0, 815000.0, 817500.0, 820000.0], dtype='float64', name='y', length=166)) - timePandasIndex
PandasIndex(DatetimeIndex(['1981-01-01', '1981-01-02', '1981-01-03', '1981-01-04',
               '1981-01-05', '1981-01-06', '1981-01-07', '1981-01-08',
               '1981-01-09', '1981-01-10',
               ...
               '2005-12-22', '2005-12-23', '2005-12-24', '2005-12-25',
               '2005-12-26', '2005-12-27', '2005-12-28', '2005-12-29',
               '2005-12-30', '2005-12-31'],
              dtype='datetime64[ns]', name='time', length=9131, freq=None))
- CDI :
- Climate Data Interface version 2.0.5 (https://mpimet.mpg.de/cdi)
- Conventions :
- CF-1.6
- CDO :
- Climate Data Operators version 2.0.5 (https://mpimet.mpg.de/cdo)
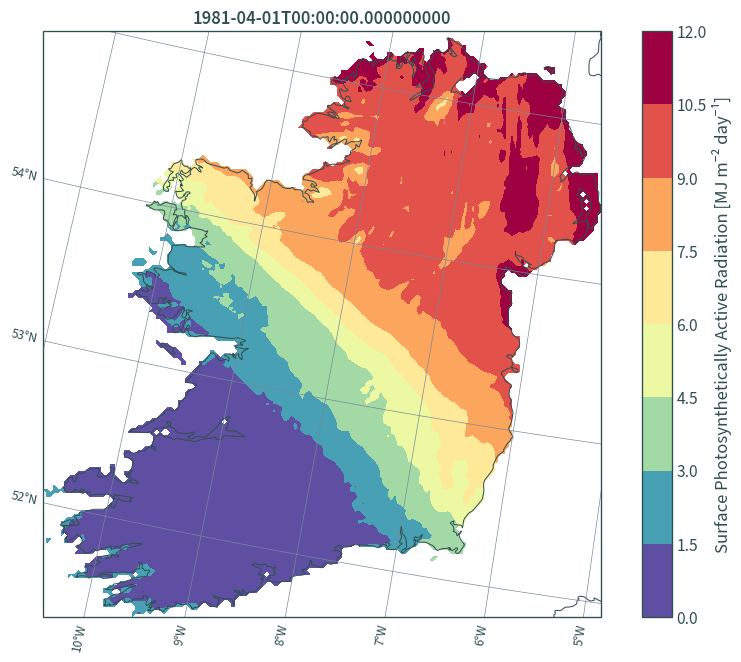
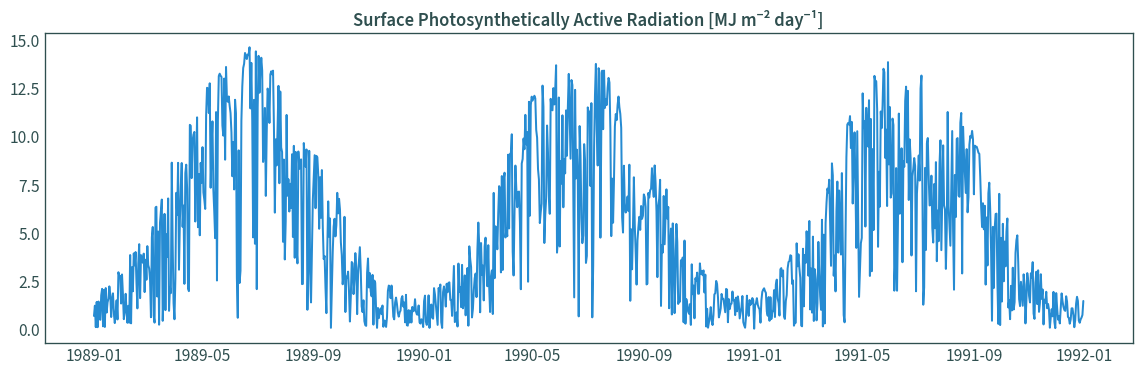
Calculate photosynthetically active radiation (PAR)#
# Papaioannou et al. (1993) - irradiance ratio
ds["117_105_0_4"] = ds["117_105_0_4"].assign(
    PAR=ds["117_105_0_4"]["grad"] * 0.473
)
ds["117_105_0_4"]["PAR"].attrs[
    "long_name"
] = "Surface Photosynthetically Active Radiation"
ds["117_105_0_4"]["PAR"].attrs["units"] = "MJ m⁻² day⁻¹"
Merge datasets#
# merge datasets
ds = xr.combine_by_coords(
    [ds["11_105_2_0"], ds["61_105_0_4"], ds["117_105_0_4"], ds["PET"]],
    combine_attrs="drop_conflicts",
    compat="override",
)
# drop global radiation
ds = ds.drop_vars(["grad"])
# rename other variables
ds = ds.rename({"t": "T", "tp": "PP"})
# assign dataset name
ds.attrs["dataset"] = "IE_MERA_FC3hr_3_day"
# reassign CRS
ds.rio.write_crs(data_crs, inplace=True)
<xarray.Dataset>
Dimensions:            (x: 158, y: 166, time: 9131)
Coordinates:
  * x                  (x) float64 4.15e+05 4.175e+05 ... 8.05e+05 8.075e+05
  * y                  (y) float64 4.075e+05 4.1e+05 ... 8.175e+05 8.2e+05
    height             float64 0.0
    Lambert_Conformal  int64 ...
  * time               (time) datetime64[ns] 1981-01-01 ... 2005-12-31
    spatial_ref        int64 0
Data variables:
    PAR                (time, y, x) float32 dask.array<chunksize=(4871, 85, 81), meta=np.ndarray>
    PET                (time, y, x) float32 dask.array<chunksize=(4756, 86, 82), meta=np.ndarray>
    T                  (time, y, x) float32 dask.array<chunksize=(4871, 85, 81), meta=np.ndarray>
    PP                 (time, y, x) float32 dask.array<chunksize=(4871, 85, 81), meta=np.ndarray>
Attributes:
    CDI:          Climate Data Interface version 2.0.5 (https://mpimet.mpg.de...
    Conventions:  CF-1.6
    CDO:          Climate Data Operators version 2.0.5 (https://mpimet.mpg.de...
    dataset:      IE_MERA_FC3hr_3_day
xarray.Dataset
- x: 158
- y: 166
- time: 9131
- x(x)float644.15e+05 4.175e+05 ... 8.075e+05
- standard_name :
- projection_x_coordinate
- units :
- metre
- axis :
- X
- long_name :
- x coordinate of projection
array([415000., 417500., 420000., 422500., 425000., 427500., 430000., 432500., 435000., 437500., 440000., 442500., 445000., 447500., 450000., 452500., 455000., 457500., 460000., 462500., 465000., 467500., 470000., 472500., 475000., 477500., 480000., 482500., 485000., 487500., 490000., 492500., 495000., 497500., 500000., 502500., 505000., 507500., 510000., 512500., 515000., 517500., 520000., 522500., 525000., 527500., 530000., 532500., 535000., 537500., 540000., 542500., 545000., 547500., 550000., 552500., 555000., 557500., 560000., 562500., 565000., 567500., 570000., 572500., 575000., 577500., 580000., 582500., 585000., 587500., 590000., 592500., 595000., 597500., 600000., 602500., 605000., 607500., 610000., 612500., 615000., 617500., 620000., 622500., 625000., 627500., 630000., 632500., 635000., 637500., 640000., 642500., 645000., 647500., 650000., 652500., 655000., 657500., 660000., 662500., 665000., 667500., 670000., 672500., 675000., 677500., 680000., 682500., 685000., 687500., 690000., 692500., 695000., 697500., 700000., 702500., 705000., 707500., 710000., 712500., 715000., 717500., 720000., 722500., 725000., 727500., 730000., 732500., 735000., 737500., 740000., 742500., 745000., 747500., 750000., 752500., 755000., 757500., 760000., 762500., 765000., 767500., 770000., 772500., 775000., 777500., 780000., 782500., 785000., 787500., 790000., 792500., 795000., 797500., 800000., 802500., 805000., 807500.]) - y(y)float644.075e+05 4.1e+05 ... 8.2e+05
- standard_name :
- projection_y_coordinate
- units :
- metre
- axis :
- Y
- long_name :
- y coordinate of projection
array([407500., 410000., 412500., 415000., 417500., 420000., 422500., 425000., 427500., 430000., 432500., 435000., 437500., 440000., 442500., 445000., 447500., 450000., 452500., 455000., 457500., 460000., 462500., 465000., 467500., 470000., 472500., 475000., 477500., 480000., 482500., 485000., 487500., 490000., 492500., 495000., 497500., 500000., 502500., 505000., 507500., 510000., 512500., 515000., 517500., 520000., 522500., 525000., 527500., 530000., 532500., 535000., 537500., 540000., 542500., 545000., 547500., 550000., 552500., 555000., 557500., 560000., 562500., 565000., 567500., 570000., 572500., 575000., 577500., 580000., 582500., 585000., 587500., 590000., 592500., 595000., 597500., 600000., 602500., 605000., 607500., 610000., 612500., 615000., 617500., 620000., 622500., 625000., 627500., 630000., 632500., 635000., 637500., 640000., 642500., 645000., 647500., 650000., 652500., 655000., 657500., 660000., 662500., 665000., 667500., 670000., 672500., 675000., 677500., 680000., 682500., 685000., 687500., 690000., 692500., 695000., 697500., 700000., 702500., 705000., 707500., 710000., 712500., 715000., 717500., 720000., 722500., 725000., 727500., 730000., 732500., 735000., 737500., 740000., 742500., 745000., 747500., 750000., 752500., 755000., 757500., 760000., 762500., 765000., 767500., 770000., 772500., 775000., 777500., 780000., 782500., 785000., 787500., 790000., 792500., 795000., 797500., 800000., 802500., 805000., 807500., 810000., 812500., 815000., 817500., 820000.]) - height()float640.0
- standard_name :
- height
- long_name :
- height
- units :
- m
- positive :
- up
- axis :
- Z
array(0.)
- Lambert_Conformal()int64...
- crs_wkt :
- PROJCS["undefined",GEOGCS["undefined",DATUM["undefined",SPHEROID["undefined",6367470,0]],PRIMEM["Greenwich",0,AUTHORITY["EPSG","8901"]],UNIT["degree",0.0174532925199433]],PROJECTION["Lambert_Conformal_Conic_1SP"],PARAMETER["latitude_of_origin",53.5],PARAMETER["central_meridian",5],PARAMETER["scale_factor",1],PARAMETER["false_easting",1481641.67696368],PARAMETER["false_northing",537326.063885016],UNIT["metre",1,AUTHORITY["EPSG","9001"]],AXIS["Easting",EAST],AXIS["Northing",NORTH]]
- semi_major_axis :
- 6367470.0
- semi_minor_axis :
- 6367470.0
- inverse_flattening :
- 0.0
- reference_ellipsoid_name :
- undefined
- longitude_of_prime_meridian :
- 0.0
- prime_meridian_name :
- Greenwich
- geographic_crs_name :
- undefined
- horizontal_datum_name :
- undefined
- projected_crs_name :
- undefined
- grid_mapping_name :
- lambert_conformal_conic
- standard_parallel :
- 53.5
- longitude_of_central_meridian :
- 5.0
- false_easting :
- 1481641.67696368
- false_northing :
- 537326.063885016
- spatial_ref :
- PROJCS["undefined",GEOGCS["undefined",DATUM["undefined",SPHEROID["undefined",6367470,0]],PRIMEM["Greenwich",0,AUTHORITY["EPSG","8901"]],UNIT["degree",0.0174532925199433]],PROJECTION["Lambert_Conformal_Conic_1SP"],PARAMETER["latitude_of_origin",53.5],PARAMETER["central_meridian",5],PARAMETER["scale_factor",1],PARAMETER["false_easting",1481641.67696368],PARAMETER["false_northing",537326.063885016],UNIT["metre",1,AUTHORITY["EPSG","9001"]],AXIS["Easting",EAST],AXIS["Northing",NORTH]]
- GeoTransform :
- 413750.0 2500.0 0.0 406250.0 0.0 2500.0
[1 values with dtype=int64]
- time(time)datetime64[ns]1981-01-01 ... 2005-12-31
- standard_name :
- time
- axis :
- T
array(['1981-01-01T00:00:00.000000000', '1981-01-02T00:00:00.000000000', '1981-01-03T00:00:00.000000000', ..., '2005-12-29T00:00:00.000000000', '2005-12-30T00:00:00.000000000', '2005-12-31T00:00:00.000000000'], dtype='datetime64[ns]') - spatial_ref()int640
- crs_wkt :
- PROJCS["undefined",GEOGCS["undefined",DATUM["undefined",SPHEROID["undefined",6367470,0]],PRIMEM["Greenwich",0,AUTHORITY["EPSG","8901"]],UNIT["degree",0.0174532925199433]],PROJECTION["Lambert_Conformal_Conic_1SP"],PARAMETER["latitude_of_origin",53.5],PARAMETER["central_meridian",5],PARAMETER["scale_factor",1],PARAMETER["false_easting",1481641.67696368],PARAMETER["false_northing",537326.063885016],UNIT["metre",1,AUTHORITY["EPSG","9001"]],AXIS["Easting",EAST],AXIS["Northing",NORTH]]
- semi_major_axis :
- 6367470.0
- semi_minor_axis :
- 6367470.0
- inverse_flattening :
- 0.0
- reference_ellipsoid_name :
- undefined
- longitude_of_prime_meridian :
- 0.0
- prime_meridian_name :
- Greenwich
- geographic_crs_name :
- undefined
- horizontal_datum_name :
- undefined
- projected_crs_name :
- undefined
- grid_mapping_name :
- lambert_conformal_conic
- standard_parallel :
- 53.5
- longitude_of_central_meridian :
- 5.0
- false_easting :
- 1481641.67696368
- false_northing :
- 537326.063885016
- spatial_ref :
- PROJCS["undefined",GEOGCS["undefined",DATUM["undefined",SPHEROID["undefined",6367470,0]],PRIMEM["Greenwich",0,AUTHORITY["EPSG","8901"]],UNIT["degree",0.0174532925199433]],PROJECTION["Lambert_Conformal_Conic_1SP"],PARAMETER["latitude_of_origin",53.5],PARAMETER["central_meridian",5],PARAMETER["scale_factor",1],PARAMETER["false_easting",1481641.67696368],PARAMETER["false_northing",537326.063885016],UNIT["metre",1,AUTHORITY["EPSG","9001"]],AXIS["Easting",EAST],AXIS["Northing",NORTH]]
- GeoTransform :
- 413750.0 2500.0 0.0 406250.0 0.0 2500.0
array(0)
- PAR(time, y, x)float32dask.array<chunksize=(4871, 85, 81), meta=np.ndarray>
- long_name :
- Surface Photosynthetically Active Radiation
- units :
- MJ m⁻² day⁻¹
Array Chunk Bytes 913.57 MiB 127.93 MiB Shape (9131, 166, 158) (4871, 85, 81) Dask graph 8 chunks in 4 graph layers Data type float32 numpy.ndarray - PET(time, y, x)float32dask.array<chunksize=(4756, 86, 82), meta=np.ndarray>
- units :
- mm day⁻¹
- long_name :
- Reference evapotranspiration
Array Chunk Bytes 913.57 MiB 127.94 MiB Shape (9131, 166, 158) (4756, 86, 82) Dask graph 8 chunks in 2 graph layers Data type float32 numpy.ndarray - T(time, y, x)float32dask.array<chunksize=(4871, 85, 81), meta=np.ndarray>
- GRIB_paramId :
- 233253011
- GRIB_numberOfPoints :
- 258681
- GRIB_typeOfLevel :
- heightAboveGround
- GRIB_stepUnits :
- 1
- GRIB_stepType :
- instant
- GRIB_gridType :
- lambert
- GRIB_DxInMetres :
- 2500
- GRIB_DyInMetres :
- 2500
- GRIB_LaDInDegrees :
- 53.5
- GRIB_Latin1InDegrees :
- 53.5
- GRIB_Latin2InDegrees :
- 53.5
- GRIB_LoVInDegrees :
- 5.0
- GRIB_NV :
- 132
- GRIB_Nx :
- 529
- GRIB_Ny :
- 489
- GRIB_cfName :
- unknown
- GRIB_cfVarName :
- unknown
- GRIB_gridDefinitionDescription :
- Lambert Conformal
- GRIB_iScansNegatively :
- 0
- GRIB_jPointsAreConsecutive :
- 0
- GRIB_jScansPositively :
- 1
- GRIB_latitudeOfFirstGridPointInDegrees :
- 46.834
- GRIB_latitudeOfSouthernPoleInDegrees :
- 0.0
- GRIB_longitudeOfFirstGridPointInDegrees :
- -14.609
- GRIB_longitudeOfSouthernPoleInDegrees :
- 0.0
- GRIB_missingValue :
- 3.4028234663852886e+38
- GRIB_name :
- Temperature
- GRIB_shortName :
- t
- GRIB_units :
- K
- long_name :
- Temperature
- units :
- °C
- standard_name :
- unknown
Array Chunk Bytes 913.57 MiB 127.93 MiB Shape (9131, 166, 158) (4871, 85, 81) Dask graph 8 chunks in 3 graph layers Data type float32 numpy.ndarray - PP(time, y, x)float32dask.array<chunksize=(4871, 85, 81), meta=np.ndarray>
- GRIB_paramId :
- 233253061
- GRIB_numberOfPoints :
- 258681
- GRIB_typeOfLevel :
- heightAboveGround
- GRIB_stepUnits :
- 1
- GRIB_stepType :
- accum
- GRIB_gridType :
- lambert
- GRIB_DxInMetres :
- 2500
- GRIB_DyInMetres :
- 2500
- GRIB_LaDInDegrees :
- 53.5
- GRIB_Latin1InDegrees :
- 53.5
- GRIB_Latin2InDegrees :
- 53.5
- GRIB_LoVInDegrees :
- 5.0
- GRIB_NV :
- 132
- GRIB_Nx :
- 529
- GRIB_Ny :
- 489
- GRIB_cfName :
- unknown
- GRIB_cfVarName :
- unknown
- GRIB_gridDefinitionDescription :
- Lambert Conformal
- GRIB_iScansNegatively :
- 0
- GRIB_jPointsAreConsecutive :
- 0
- GRIB_jScansPositively :
- 1
- GRIB_latitudeOfFirstGridPointInDegrees :
- 46.834
- GRIB_latitudeOfSouthernPoleInDegrees :
- 0.0
- GRIB_longitudeOfFirstGridPointInDegrees :
- -14.609
- GRIB_longitudeOfSouthernPoleInDegrees :
- 0.0
- GRIB_missingValue :
- 3.4028234663852886e+38
- GRIB_name :
- Total precipitation
- GRIB_shortName :
- tp
- GRIB_units :
- kg m**-2
- long_name :
- Total precipitation
- units :
- mm day⁻¹
- standard_name :
- unknown
Array Chunk Bytes 913.57 MiB 127.93 MiB Shape (9131, 166, 158) (4871, 85, 81) Dask graph 8 chunks in 3 graph layers Data type float32 numpy.ndarray
- xPandasIndex
PandasIndex(Float64Index([415000.0, 417500.0, 420000.0, 422500.0, 425000.0, 427500.0, 430000.0, 432500.0, 435000.0, 437500.0, ... 785000.0, 787500.0, 790000.0, 792500.0, 795000.0, 797500.0, 800000.0, 802500.0, 805000.0, 807500.0], dtype='float64', name='x', length=158)) - yPandasIndex
PandasIndex(Float64Index([407500.0, 410000.0, 412500.0, 415000.0, 417500.0, 420000.0, 422500.0, 425000.0, 427500.0, 430000.0, ... 797500.0, 800000.0, 802500.0, 805000.0, 807500.0, 810000.0, 812500.0, 815000.0, 817500.0, 820000.0], dtype='float64', name='y', length=166)) - timePandasIndex
PandasIndex(DatetimeIndex(['1981-01-01', '1981-01-02', '1981-01-03', '1981-01-04',
               '1981-01-05', '1981-01-06', '1981-01-07', '1981-01-08',
               '1981-01-09', '1981-01-10',
               ...
               '2005-12-22', '2005-12-23', '2005-12-24', '2005-12-25',
               '2005-12-26', '2005-12-27', '2005-12-28', '2005-12-29',
               '2005-12-30', '2005-12-31'],
              dtype='datetime64[ns]', name='time', length=9131, freq=None))
- CDI :
- Climate Data Interface version 2.0.5 (https://mpimet.mpg.de/cdi)
- Conventions :
- CF-1.6
- CDO :
- Climate Data Operators version 2.0.5 (https://mpimet.mpg.de/cdo)
- dataset :
- IE_MERA_FC3hr_3_day
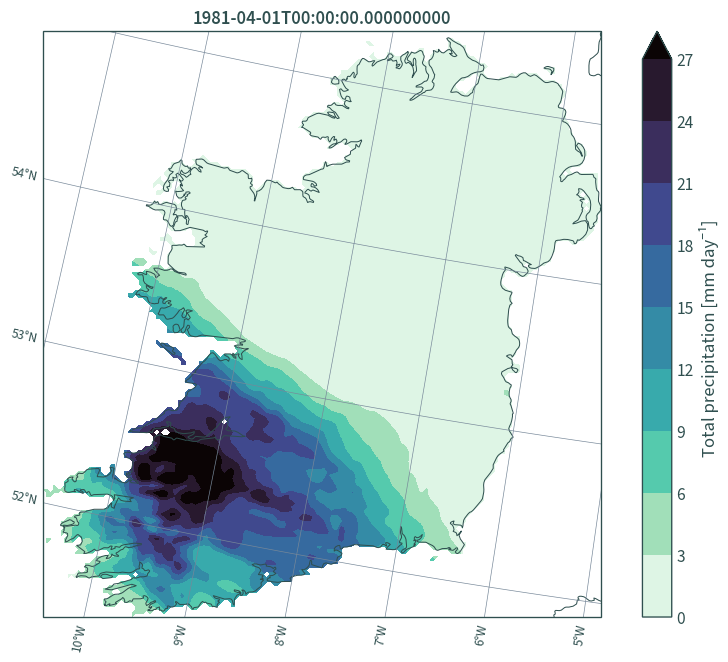
Visualise#
# Moorepark, Fermoy met station coords
LON, LAT = -8.26389, 52.16389
# transform coordinates from lon/lat to Lambert Conformal Conic
XLON, YLAT = cplt.projection_lambert_conformal.transform_point(
    x=LON, y=LAT, src_crs=ccrs.PlateCarree()
)
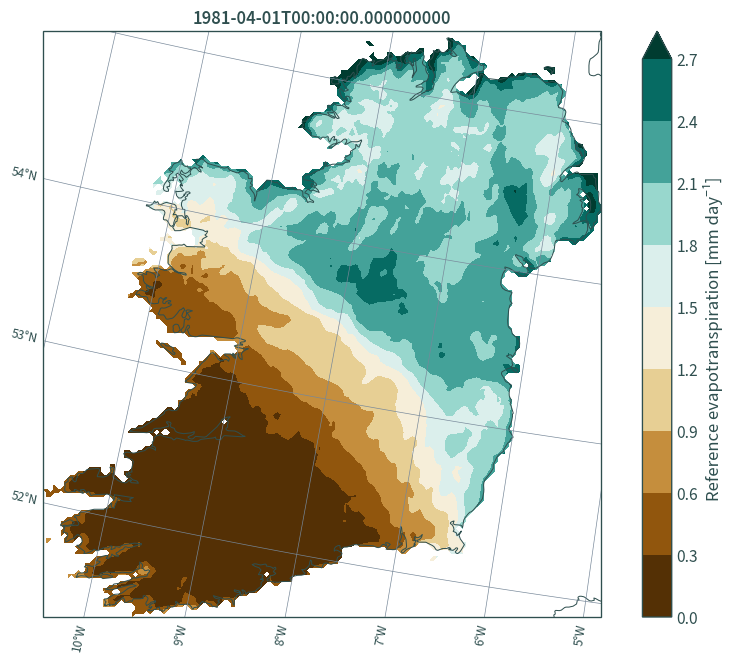
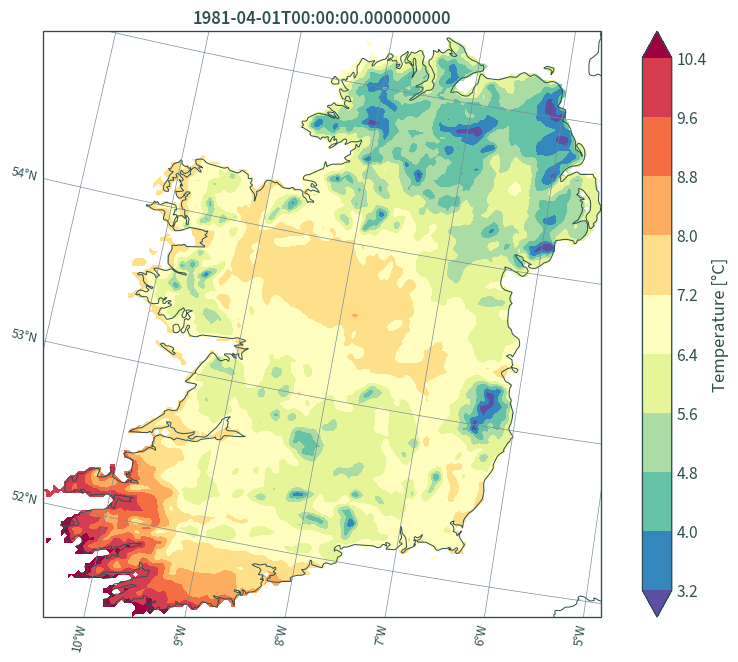
def plot_map(data, var, cmap="Spectral_r"):
    """
    Helper function for plotting maps
    """

    plt.figure(figsize=(9, 7))
    ax = plt.axes(projection=cplt.projection_lambert_conformal)
    data.isel(time=120)[var].plot.contourf(
        ax=ax,
        robust=True,
        x="x",
        y="y",
        levels=10,
        transform=cplt.projection_lambert_conformal,
        cmap=cmap,
        cbar_kwargs={
            "label": (
                data[var].attrs["long_name"]
                + " ["
                + data[var].attrs["units"]
                + "]"
            )
        },
    )
    ax.gridlines(
        draw_labels=dict(bottom="x", left="y"),
        color="lightslategrey",
        linewidth=0.5,
        x_inline=False,
        y_inline=False,
    )
    ax.coastlines(resolution="10m", color="darkslategrey", linewidth=0.75)
    ax.set_title(str(data.isel(time=90)["time"].values))
    plt.tight_layout()
    plt.show()
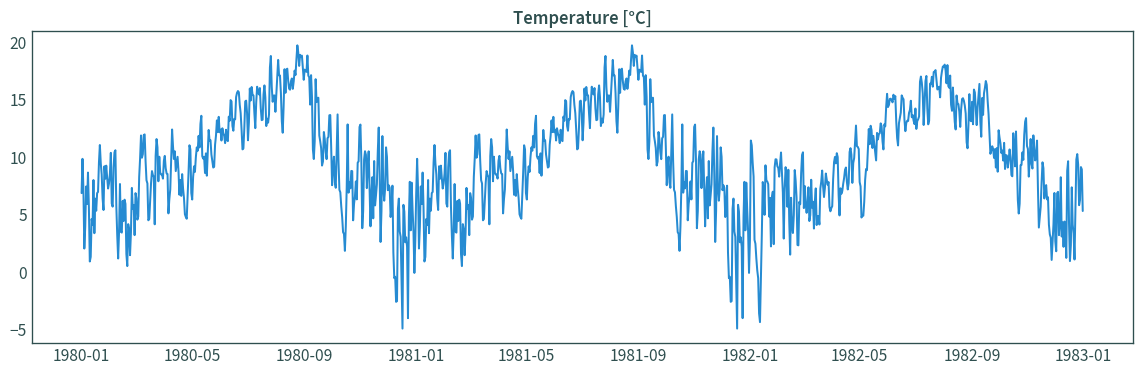
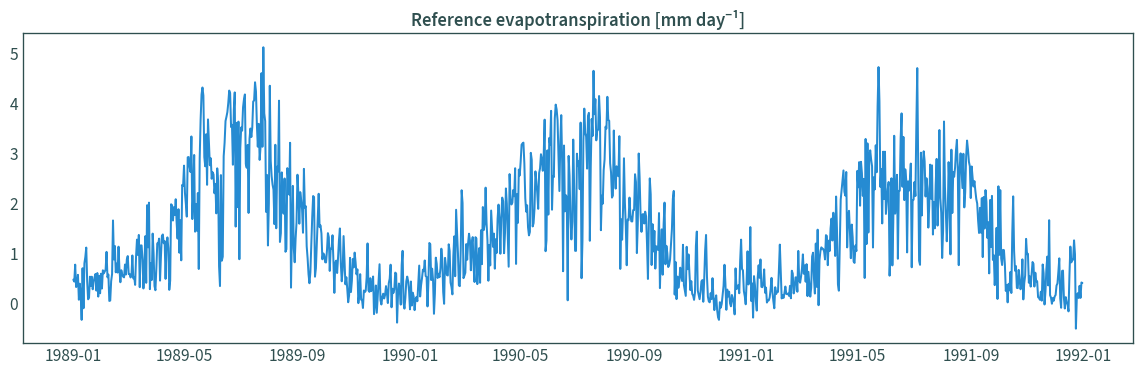
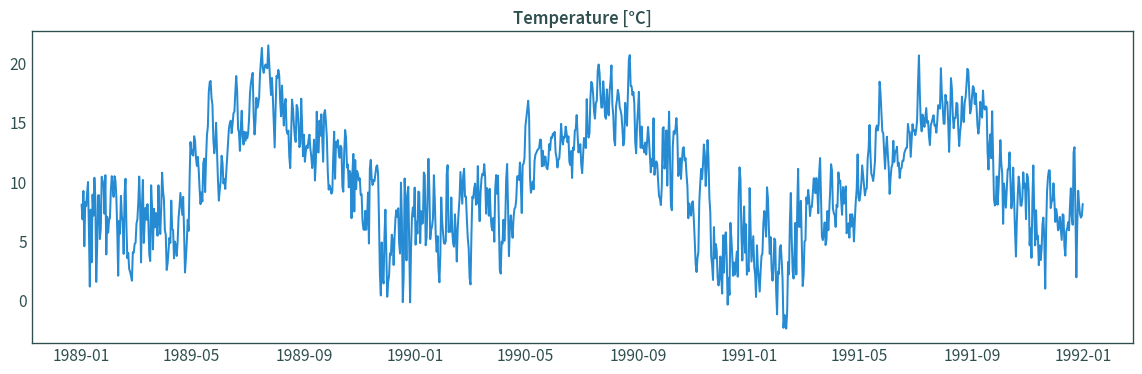
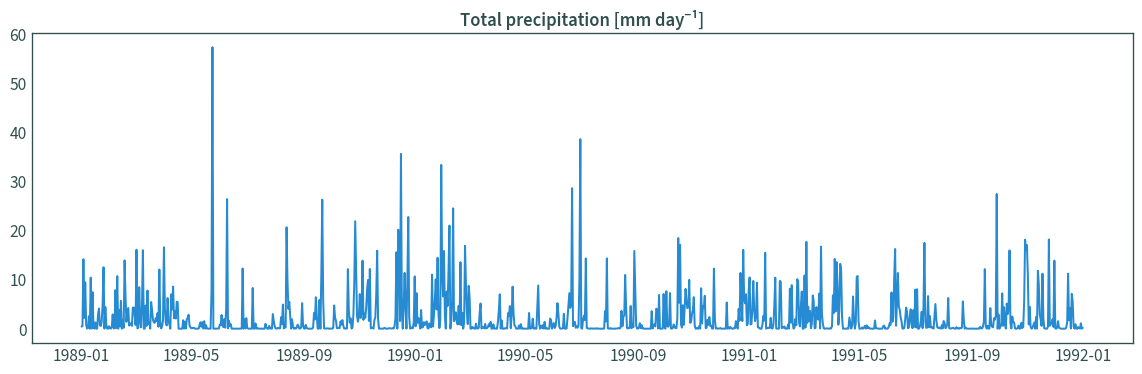
def plot_ts(data, var):
    """
    Helper function for plotting time series
    """

    plt.figure(figsize=(12, 4))
    data_ts = data.sel({"x": XLON, "y": YLAT}, method="nearest")
    data_ts = data_ts.sel(time=slice("1989", "1991"))
    plt.plot(data_ts["time"], data_ts[var])
    plt.title(
        data[var].attrs["long_name"] + " [" + data[var].attrs["units"] + "]"
    )
    plt.tight_layout()
    plt.show()
for var in ds.data_vars:
    plot_map(ds, var, climag_plot.colormap_configs(var))
for var in ds.data_vars:
    plot_ts(ds, var)
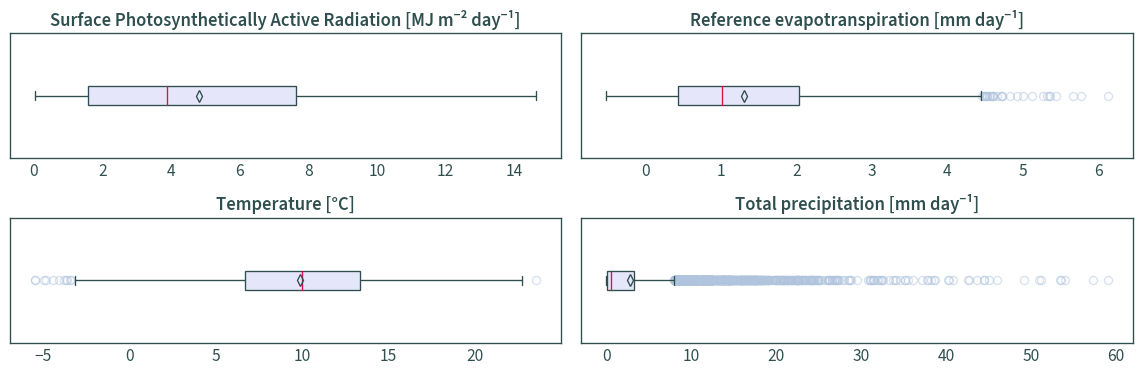
# box plots
ds_box = ds.sel({"x": XLON, "y": YLAT}, method="nearest").sel(
    time=slice("1981", "2005")
)

ds_df = pd.DataFrame({"time": ds_box["time"]})
for var in ds_box.data_vars:
    ds_df[var] = ds_box[var]
ds_df.set_index("time", inplace=True)

fig, axs = plt.subplots(2, 2, figsize=(12, 4))
for ax, var in zip(axs.flat, ds_box.data_vars):
    ds_df.plot.box(
        column=var,
        vert=False,
        showmeans=True,
        ax=ax,
        patch_artist=True,
        color={
            "medians": "Crimson",
            "whiskers": "DarkSlateGrey",
            "caps": "DarkSlateGrey",
        },
        boxprops={"facecolor": "Lavender", "color": "DarkSlateGrey"},
        meanprops={
            "markeredgecolor": "DarkSlateGrey",
            "marker": "d",
            "markerfacecolor": (1, 1, 0, 0),  # transparent
        },
        flierprops={
            "alpha": 0.5,
            "markeredgecolor": "LightSteelBlue",
            "zorder": 1,
        },
    )
    ax.set_title(
        f"{ds_box[var].attrs['long_name']} [{ds_box[var].attrs['units']}]"
    )
    ax.set(yticklabels=[])
plt.tight_layout()
plt.show()
Extend data to spin-up year#
# copy 1981 data to 1980
ds_interp = ds.interp(
    time=pd.date_range("1980-01-01", "1980-12-31", freq="D"),
    kwargs={"fill_value": None},
)
ds_interp.rio.write_crs(data_crs, inplace=True)
<xarray.Dataset>
Dimensions:            (x: 158, y: 166, time: 366)
Coordinates:
  * x                  (x) float64 4.15e+05 4.175e+05 ... 8.05e+05 8.075e+05
  * y                  (y) float64 4.075e+05 4.1e+05 ... 8.175e+05 8.2e+05
    height             float64 0.0
    Lambert_Conformal  int64 ...
  * time               (time) datetime64[ns] 1980-01-01 ... 1980-12-31
    spatial_ref        int64 0
Data variables:
    PAR                (time, y, x) float32 dask.array<chunksize=(366, 85, 81), meta=np.ndarray>
    PET                (time, y, x) float32 dask.array<chunksize=(366, 86, 82), meta=np.ndarray>
    T                  (time, y, x) float32 dask.array<chunksize=(366, 85, 81), meta=np.ndarray>
    PP                 (time, y, x) float32 dask.array<chunksize=(366, 85, 81), meta=np.ndarray>
Attributes:
    CDI:          Climate Data Interface version 2.0.5 (https://mpimet.mpg.de...
    Conventions:  CF-1.6
    CDO:          Climate Data Operators version 2.0.5 (https://mpimet.mpg.de...
    dataset:      IE_MERA_FC3hr_3_day
xarray.Dataset
- x: 158
- y: 166
- time: 366
- x(x)float644.15e+05 4.175e+05 ... 8.075e+05
- standard_name :
- projection_x_coordinate
- units :
- metre
- axis :
- X
- long_name :
- x coordinate of projection
array([415000., 417500., 420000., 422500., 425000., 427500., 430000., 432500., 435000., 437500., 440000., 442500., 445000., 447500., 450000., 452500., 455000., 457500., 460000., 462500., 465000., 467500., 470000., 472500., 475000., 477500., 480000., 482500., 485000., 487500., 490000., 492500., 495000., 497500., 500000., 502500., 505000., 507500., 510000., 512500., 515000., 517500., 520000., 522500., 525000., 527500., 530000., 532500., 535000., 537500., 540000., 542500., 545000., 547500., 550000., 552500., 555000., 557500., 560000., 562500., 565000., 567500., 570000., 572500., 575000., 577500., 580000., 582500., 585000., 587500., 590000., 592500., 595000., 597500., 600000., 602500., 605000., 607500., 610000., 612500., 615000., 617500., 620000., 622500., 625000., 627500., 630000., 632500., 635000., 637500., 640000., 642500., 645000., 647500., 650000., 652500., 655000., 657500., 660000., 662500., 665000., 667500., 670000., 672500., 675000., 677500., 680000., 682500., 685000., 687500., 690000., 692500., 695000., 697500., 700000., 702500., 705000., 707500., 710000., 712500., 715000., 717500., 720000., 722500., 725000., 727500., 730000., 732500., 735000., 737500., 740000., 742500., 745000., 747500., 750000., 752500., 755000., 757500., 760000., 762500., 765000., 767500., 770000., 772500., 775000., 777500., 780000., 782500., 785000., 787500., 790000., 792500., 795000., 797500., 800000., 802500., 805000., 807500.]) - y(y)float644.075e+05 4.1e+05 ... 8.2e+05
- standard_name :
- projection_y_coordinate
- units :
- metre
- axis :
- Y
- long_name :
- y coordinate of projection
array([407500., 410000., 412500., 415000., 417500., 420000., 422500., 425000., 427500., 430000., 432500., 435000., 437500., 440000., 442500., 445000., 447500., 450000., 452500., 455000., 457500., 460000., 462500., 465000., 467500., 470000., 472500., 475000., 477500., 480000., 482500., 485000., 487500., 490000., 492500., 495000., 497500., 500000., 502500., 505000., 507500., 510000., 512500., 515000., 517500., 520000., 522500., 525000., 527500., 530000., 532500., 535000., 537500., 540000., 542500., 545000., 547500., 550000., 552500., 555000., 557500., 560000., 562500., 565000., 567500., 570000., 572500., 575000., 577500., 580000., 582500., 585000., 587500., 590000., 592500., 595000., 597500., 600000., 602500., 605000., 607500., 610000., 612500., 615000., 617500., 620000., 622500., 625000., 627500., 630000., 632500., 635000., 637500., 640000., 642500., 645000., 647500., 650000., 652500., 655000., 657500., 660000., 662500., 665000., 667500., 670000., 672500., 675000., 677500., 680000., 682500., 685000., 687500., 690000., 692500., 695000., 697500., 700000., 702500., 705000., 707500., 710000., 712500., 715000., 717500., 720000., 722500., 725000., 727500., 730000., 732500., 735000., 737500., 740000., 742500., 745000., 747500., 750000., 752500., 755000., 757500., 760000., 762500., 765000., 767500., 770000., 772500., 775000., 777500., 780000., 782500., 785000., 787500., 790000., 792500., 795000., 797500., 800000., 802500., 805000., 807500., 810000., 812500., 815000., 817500., 820000.]) - height()float640.0
- standard_name :
- height
- long_name :
- height
- units :
- m
- positive :
- up
- axis :
- Z
array(0.)
- Lambert_Conformal()int64...
- crs_wkt :
- PROJCS["undefined",GEOGCS["undefined",DATUM["undefined",SPHEROID["undefined",6367470,0]],PRIMEM["Greenwich",0,AUTHORITY["EPSG","8901"]],UNIT["degree",0.0174532925199433]],PROJECTION["Lambert_Conformal_Conic_1SP"],PARAMETER["latitude_of_origin",53.5],PARAMETER["central_meridian",5],PARAMETER["scale_factor",1],PARAMETER["false_easting",1481641.67696368],PARAMETER["false_northing",537326.063885016],UNIT["metre",1,AUTHORITY["EPSG","9001"]],AXIS["Easting",EAST],AXIS["Northing",NORTH]]
- semi_major_axis :
- 6367470.0
- semi_minor_axis :
- 6367470.0
- inverse_flattening :
- 0.0
- reference_ellipsoid_name :
- undefined
- longitude_of_prime_meridian :
- 0.0
- prime_meridian_name :
- Greenwich
- geographic_crs_name :
- undefined
- horizontal_datum_name :
- undefined
- projected_crs_name :
- undefined
- grid_mapping_name :
- lambert_conformal_conic
- standard_parallel :
- 53.5
- longitude_of_central_meridian :
- 5.0
- false_easting :
- 1481641.67696368
- false_northing :
- 537326.063885016
- spatial_ref :
- PROJCS["undefined",GEOGCS["undefined",DATUM["undefined",SPHEROID["undefined",6367470,0]],PRIMEM["Greenwich",0,AUTHORITY["EPSG","8901"]],UNIT["degree",0.0174532925199433]],PROJECTION["Lambert_Conformal_Conic_1SP"],PARAMETER["latitude_of_origin",53.5],PARAMETER["central_meridian",5],PARAMETER["scale_factor",1],PARAMETER["false_easting",1481641.67696368],PARAMETER["false_northing",537326.063885016],UNIT["metre",1,AUTHORITY["EPSG","9001"]],AXIS["Easting",EAST],AXIS["Northing",NORTH]]
- GeoTransform :
- 413750.0 2500.0 0.0 406250.0 0.0 2500.0
[1 values with dtype=int64]
- time(time)datetime64[ns]1980-01-01 ... 1980-12-31
- standard_name :
- time
- axis :
- T
array(['1980-01-01T00:00:00.000000000', '1980-01-02T00:00:00.000000000', '1980-01-03T00:00:00.000000000', ..., '1980-12-29T00:00:00.000000000', '1980-12-30T00:00:00.000000000', '1980-12-31T00:00:00.000000000'], dtype='datetime64[ns]') - spatial_ref()int640
- crs_wkt :
- PROJCS["undefined",GEOGCS["undefined",DATUM["undefined",SPHEROID["undefined",6367470,0]],PRIMEM["Greenwich",0,AUTHORITY["EPSG","8901"]],UNIT["degree",0.0174532925199433]],PROJECTION["Lambert_Conformal_Conic_1SP"],PARAMETER["latitude_of_origin",53.5],PARAMETER["central_meridian",5],PARAMETER["scale_factor",1],PARAMETER["false_easting",1481641.67696368],PARAMETER["false_northing",537326.063885016],UNIT["metre",1,AUTHORITY["EPSG","9001"]],AXIS["Easting",EAST],AXIS["Northing",NORTH]]
- semi_major_axis :
- 6367470.0
- semi_minor_axis :
- 6367470.0
- inverse_flattening :
- 0.0
- reference_ellipsoid_name :
- undefined
- longitude_of_prime_meridian :
- 0.0
- prime_meridian_name :
- Greenwich
- geographic_crs_name :
- undefined
- horizontal_datum_name :
- undefined
- projected_crs_name :
- undefined
- grid_mapping_name :
- lambert_conformal_conic
- standard_parallel :
- 53.5
- longitude_of_central_meridian :
- 5.0
- false_easting :
- 1481641.67696368
- false_northing :
- 537326.063885016
- spatial_ref :
- PROJCS["undefined",GEOGCS["undefined",DATUM["undefined",SPHEROID["undefined",6367470,0]],PRIMEM["Greenwich",0,AUTHORITY["EPSG","8901"]],UNIT["degree",0.0174532925199433]],PROJECTION["Lambert_Conformal_Conic_1SP"],PARAMETER["latitude_of_origin",53.5],PARAMETER["central_meridian",5],PARAMETER["scale_factor",1],PARAMETER["false_easting",1481641.67696368],PARAMETER["false_northing",537326.063885016],UNIT["metre",1,AUTHORITY["EPSG","9001"]],AXIS["Easting",EAST],AXIS["Northing",NORTH]]
- GeoTransform :
- 413750.0 2500.0 0.0 406250.0 0.0 2500.0
array(0)
- PAR(time, y, x)float32dask.array<chunksize=(366, 85, 81), meta=np.ndarray>
- long_name :
- Surface Photosynthetically Active Radiation
- units :
- MJ m⁻² day⁻¹
Array Chunk Bytes 36.62 MiB 9.61 MiB Shape (366, 166, 158) (366, 85, 81) Dask graph 4 chunks in 12 graph layers Data type float32 numpy.ndarray - PET(time, y, x)float32dask.array<chunksize=(366, 86, 82), meta=np.ndarray>
- units :
- mm day⁻¹
- long_name :
- Reference evapotranspiration
Array Chunk Bytes 36.62 MiB 9.85 MiB Shape (366, 166, 158) (366, 86, 82) Dask graph 4 chunks in 10 graph layers Data type float32 numpy.ndarray - T(time, y, x)float32dask.array<chunksize=(366, 85, 81), meta=np.ndarray>
- GRIB_paramId :
- 233253011
- GRIB_numberOfPoints :
- 258681
- GRIB_typeOfLevel :
- heightAboveGround
- GRIB_stepUnits :
- 1
- GRIB_stepType :
- instant
- GRIB_gridType :
- lambert
- GRIB_DxInMetres :
- 2500
- GRIB_DyInMetres :
- 2500
- GRIB_LaDInDegrees :
- 53.5
- GRIB_Latin1InDegrees :
- 53.5
- GRIB_Latin2InDegrees :
- 53.5
- GRIB_LoVInDegrees :
- 5.0
- GRIB_NV :
- 132
- GRIB_Nx :
- 529
- GRIB_Ny :
- 489
- GRIB_cfName :
- unknown
- GRIB_cfVarName :
- unknown
- GRIB_gridDefinitionDescription :
- Lambert Conformal
- GRIB_iScansNegatively :
- 0
- GRIB_jPointsAreConsecutive :
- 0
- GRIB_jScansPositively :
- 1
- GRIB_latitudeOfFirstGridPointInDegrees :
- 46.834
- GRIB_latitudeOfSouthernPoleInDegrees :
- 0.0
- GRIB_longitudeOfFirstGridPointInDegrees :
- -14.609
- GRIB_longitudeOfSouthernPoleInDegrees :
- 0.0
- GRIB_missingValue :
- 3.4028234663852886e+38
- GRIB_name :
- Temperature
- GRIB_shortName :
- t
- GRIB_units :
- K
- long_name :
- Temperature
- units :
- °C
- standard_name :
- unknown
Array Chunk Bytes 36.62 MiB 9.61 MiB Shape (366, 166, 158) (366, 85, 81) Dask graph 4 chunks in 11 graph layers Data type float32 numpy.ndarray - PP(time, y, x)float32dask.array<chunksize=(366, 85, 81), meta=np.ndarray>
- GRIB_paramId :
- 233253061
- GRIB_numberOfPoints :
- 258681
- GRIB_typeOfLevel :
- heightAboveGround
- GRIB_stepUnits :
- 1
- GRIB_stepType :
- accum
- GRIB_gridType :
- lambert
- GRIB_DxInMetres :
- 2500
- GRIB_DyInMetres :
- 2500
- GRIB_LaDInDegrees :
- 53.5
- GRIB_Latin1InDegrees :
- 53.5
- GRIB_Latin2InDegrees :
- 53.5
- GRIB_LoVInDegrees :
- 5.0
- GRIB_NV :
- 132
- GRIB_Nx :
- 529
- GRIB_Ny :
- 489
- GRIB_cfName :
- unknown
- GRIB_cfVarName :
- unknown
- GRIB_gridDefinitionDescription :
- Lambert Conformal
- GRIB_iScansNegatively :
- 0
- GRIB_jPointsAreConsecutive :
- 0
- GRIB_jScansPositively :
- 1
- GRIB_latitudeOfFirstGridPointInDegrees :
- 46.834
- GRIB_latitudeOfSouthernPoleInDegrees :
- 0.0
- GRIB_longitudeOfFirstGridPointInDegrees :
- -14.609
- GRIB_longitudeOfSouthernPoleInDegrees :
- 0.0
- GRIB_missingValue :
- 3.4028234663852886e+38
- GRIB_name :
- Total precipitation
- GRIB_shortName :
- tp
- GRIB_units :
- kg m**-2
- long_name :
- Total precipitation
- units :
- mm day⁻¹
- standard_name :
- unknown
Array Chunk Bytes 36.62 MiB 9.61 MiB Shape (366, 166, 158) (366, 85, 81) Dask graph 4 chunks in 11 graph layers Data type float32 numpy.ndarray
- xPandasIndex
PandasIndex(Float64Index([415000.0, 417500.0, 420000.0, 422500.0, 425000.0, 427500.0, 430000.0, 432500.0, 435000.0, 437500.0, ... 785000.0, 787500.0, 790000.0, 792500.0, 795000.0, 797500.0, 800000.0, 802500.0, 805000.0, 807500.0], dtype='float64', name='x', length=158)) - yPandasIndex
PandasIndex(Float64Index([407500.0, 410000.0, 412500.0, 415000.0, 417500.0, 420000.0, 422500.0, 425000.0, 427500.0, 430000.0, ... 797500.0, 800000.0, 802500.0, 805000.0, 807500.0, 810000.0, 812500.0, 815000.0, 817500.0, 820000.0], dtype='float64', name='y', length=166)) - timePandasIndex
PandasIndex(DatetimeIndex(['1980-01-01', '1980-01-02', '1980-01-03', '1980-01-04',
               '1980-01-05', '1980-01-06', '1980-01-07', '1980-01-08',
               '1980-01-09', '1980-01-10',
               ...
               '1980-12-22', '1980-12-23', '1980-12-24', '1980-12-25',
               '1980-12-26', '1980-12-27', '1980-12-28', '1980-12-29',
               '1980-12-30', '1980-12-31'],
              dtype='datetime64[ns]', name='time', length=366, freq=None))
- CDI :
- Climate Data Interface version 2.0.5 (https://mpimet.mpg.de/cdi)
- Conventions :
- CF-1.6
- CDO :
- Climate Data Operators version 2.0.5 (https://mpimet.mpg.de/cdo)
- dataset :
- IE_MERA_FC3hr_3_day
# merge spin-up year with first two years of the main data
ds_interp = xr.combine_by_coords(
    [ds_interp, ds.sel(time=slice("1981", "1982"))]
)
ds_interp
<xarray.Dataset>
Dimensions:            (x: 158, y: 166, time: 1096)
Coordinates:
  * x                  (x) float64 4.15e+05 4.175e+05 ... 8.05e+05 8.075e+05
  * y                  (y) float64 4.075e+05 4.1e+05 ... 8.175e+05 8.2e+05
    height             float64 0.0
    Lambert_Conformal  int64 0
  * time               (time) datetime64[ns] 1980-01-01 ... 1982-12-31
    spatial_ref        int64 0
Data variables:
    PAR                (time, y, x) float32 dask.array<chunksize=(366, 85, 81), meta=np.ndarray>
    PET                (time, y, x) float32 dask.array<chunksize=(366, 86, 82), meta=np.ndarray>
    T                  (time, y, x) float32 dask.array<chunksize=(366, 85, 81), meta=np.ndarray>
    PP                 (time, y, x) float32 dask.array<chunksize=(366, 85, 81), meta=np.ndarray>
Attributes:
    CDI:          Climate Data Interface version 2.0.5 (https://mpimet.mpg.de...
    Conventions:  CF-1.6
    CDO:          Climate Data Operators version 2.0.5 (https://mpimet.mpg.de...
    dataset:      IE_MERA_FC3hr_3_day
xarray.Dataset
- x: 158
- y: 166
- time: 1096
- x(x)float644.15e+05 4.175e+05 ... 8.075e+05
- standard_name :
- projection_x_coordinate
- units :
- metre
- axis :
- X
- long_name :
- x coordinate of projection
array([415000., 417500., 420000., 422500., 425000., 427500., 430000., 432500., 435000., 437500., 440000., 442500., 445000., 447500., 450000., 452500., 455000., 457500., 460000., 462500., 465000., 467500., 470000., 472500., 475000., 477500., 480000., 482500., 485000., 487500., 490000., 492500., 495000., 497500., 500000., 502500., 505000., 507500., 510000., 512500., 515000., 517500., 520000., 522500., 525000., 527500., 530000., 532500., 535000., 537500., 540000., 542500., 545000., 547500., 550000., 552500., 555000., 557500., 560000., 562500., 565000., 567500., 570000., 572500., 575000., 577500., 580000., 582500., 585000., 587500., 590000., 592500., 595000., 597500., 600000., 602500., 605000., 607500., 610000., 612500., 615000., 617500., 620000., 622500., 625000., 627500., 630000., 632500., 635000., 637500., 640000., 642500., 645000., 647500., 650000., 652500., 655000., 657500., 660000., 662500., 665000., 667500., 670000., 672500., 675000., 677500., 680000., 682500., 685000., 687500., 690000., 692500., 695000., 697500., 700000., 702500., 705000., 707500., 710000., 712500., 715000., 717500., 720000., 722500., 725000., 727500., 730000., 732500., 735000., 737500., 740000., 742500., 745000., 747500., 750000., 752500., 755000., 757500., 760000., 762500., 765000., 767500., 770000., 772500., 775000., 777500., 780000., 782500., 785000., 787500., 790000., 792500., 795000., 797500., 800000., 802500., 805000., 807500.]) - y(y)float644.075e+05 4.1e+05 ... 8.2e+05
- standard_name :
- projection_y_coordinate
- units :
- metre
- axis :
- Y
- long_name :
- y coordinate of projection
array([407500., 410000., 412500., 415000., 417500., 420000., 422500., 425000., 427500., 430000., 432500., 435000., 437500., 440000., 442500., 445000., 447500., 450000., 452500., 455000., 457500., 460000., 462500., 465000., 467500., 470000., 472500., 475000., 477500., 480000., 482500., 485000., 487500., 490000., 492500., 495000., 497500., 500000., 502500., 505000., 507500., 510000., 512500., 515000., 517500., 520000., 522500., 525000., 527500., 530000., 532500., 535000., 537500., 540000., 542500., 545000., 547500., 550000., 552500., 555000., 557500., 560000., 562500., 565000., 567500., 570000., 572500., 575000., 577500., 580000., 582500., 585000., 587500., 590000., 592500., 595000., 597500., 600000., 602500., 605000., 607500., 610000., 612500., 615000., 617500., 620000., 622500., 625000., 627500., 630000., 632500., 635000., 637500., 640000., 642500., 645000., 647500., 650000., 652500., 655000., 657500., 660000., 662500., 665000., 667500., 670000., 672500., 675000., 677500., 680000., 682500., 685000., 687500., 690000., 692500., 695000., 697500., 700000., 702500., 705000., 707500., 710000., 712500., 715000., 717500., 720000., 722500., 725000., 727500., 730000., 732500., 735000., 737500., 740000., 742500., 745000., 747500., 750000., 752500., 755000., 757500., 760000., 762500., 765000., 767500., 770000., 772500., 775000., 777500., 780000., 782500., 785000., 787500., 790000., 792500., 795000., 797500., 800000., 802500., 805000., 807500., 810000., 812500., 815000., 817500., 820000.]) - height()float640.0
- standard_name :
- height
- long_name :
- height
- units :
- m
- positive :
- up
- axis :
- Z
array(0.)
- Lambert_Conformal()int640
- crs_wkt :
- PROJCS["undefined",GEOGCS["undefined",DATUM["undefined",SPHEROID["undefined",6367470,0]],PRIMEM["Greenwich",0,AUTHORITY["EPSG","8901"]],UNIT["degree",0.0174532925199433]],PROJECTION["Lambert_Conformal_Conic_1SP"],PARAMETER["latitude_of_origin",53.5],PARAMETER["central_meridian",5],PARAMETER["scale_factor",1],PARAMETER["false_easting",1481641.67696368],PARAMETER["false_northing",537326.063885016],UNIT["metre",1,AUTHORITY["EPSG","9001"]],AXIS["Easting",EAST],AXIS["Northing",NORTH]]
- semi_major_axis :
- 6367470.0
- semi_minor_axis :
- 6367470.0
- inverse_flattening :
- 0.0
- reference_ellipsoid_name :
- undefined
- longitude_of_prime_meridian :
- 0.0
- prime_meridian_name :
- Greenwich
- geographic_crs_name :
- undefined
- horizontal_datum_name :
- undefined
- projected_crs_name :
- undefined
- grid_mapping_name :
- lambert_conformal_conic
- standard_parallel :
- 53.5
- longitude_of_central_meridian :
- 5.0
- false_easting :
- 1481641.67696368
- false_northing :
- 537326.063885016
- spatial_ref :
- PROJCS["undefined",GEOGCS["undefined",DATUM["undefined",SPHEROID["undefined",6367470,0]],PRIMEM["Greenwich",0,AUTHORITY["EPSG","8901"]],UNIT["degree",0.0174532925199433]],PROJECTION["Lambert_Conformal_Conic_1SP"],PARAMETER["latitude_of_origin",53.5],PARAMETER["central_meridian",5],PARAMETER["scale_factor",1],PARAMETER["false_easting",1481641.67696368],PARAMETER["false_northing",537326.063885016],UNIT["metre",1,AUTHORITY["EPSG","9001"]],AXIS["Easting",EAST],AXIS["Northing",NORTH]]
- GeoTransform :
- 413750.0 2500.0 0.0 406250.0 0.0 2500.0
array(0)
- time(time)datetime64[ns]1980-01-01 ... 1982-12-31
- standard_name :
- time
- axis :
- T
array(['1980-01-01T00:00:00.000000000', '1980-01-02T00:00:00.000000000', '1980-01-03T00:00:00.000000000', ..., '1982-12-29T00:00:00.000000000', '1982-12-30T00:00:00.000000000', '1982-12-31T00:00:00.000000000'], dtype='datetime64[ns]') - spatial_ref()int640
- crs_wkt :
- PROJCS["undefined",GEOGCS["undefined",DATUM["undefined",SPHEROID["undefined",6367470,0]],PRIMEM["Greenwich",0,AUTHORITY["EPSG","8901"]],UNIT["degree",0.0174532925199433]],PROJECTION["Lambert_Conformal_Conic_1SP"],PARAMETER["latitude_of_origin",53.5],PARAMETER["central_meridian",5],PARAMETER["scale_factor",1],PARAMETER["false_easting",1481641.67696368],PARAMETER["false_northing",537326.063885016],UNIT["metre",1,AUTHORITY["EPSG","9001"]],AXIS["Easting",EAST],AXIS["Northing",NORTH]]
- semi_major_axis :
- 6367470.0
- semi_minor_axis :
- 6367470.0
- inverse_flattening :
- 0.0
- reference_ellipsoid_name :
- undefined
- longitude_of_prime_meridian :
- 0.0
- prime_meridian_name :
- Greenwich
- geographic_crs_name :
- undefined
- horizontal_datum_name :
- undefined
- projected_crs_name :
- undefined
- grid_mapping_name :
- lambert_conformal_conic
- standard_parallel :
- 53.5
- longitude_of_central_meridian :
- 5.0
- false_easting :
- 1481641.67696368
- false_northing :
- 537326.063885016
- spatial_ref :
- PROJCS["undefined",GEOGCS["undefined",DATUM["undefined",SPHEROID["undefined",6367470,0]],PRIMEM["Greenwich",0,AUTHORITY["EPSG","8901"]],UNIT["degree",0.0174532925199433]],PROJECTION["Lambert_Conformal_Conic_1SP"],PARAMETER["latitude_of_origin",53.5],PARAMETER["central_meridian",5],PARAMETER["scale_factor",1],PARAMETER["false_easting",1481641.67696368],PARAMETER["false_northing",537326.063885016],UNIT["metre",1,AUTHORITY["EPSG","9001"]],AXIS["Easting",EAST],AXIS["Northing",NORTH]]
- GeoTransform :
- 413750.0 2500.0 0.0 406250.0 0.0 2500.0
array(0)
- PAR(time, y, x)float32dask.array<chunksize=(366, 85, 81), meta=np.ndarray>
- long_name :
- Surface Photosynthetically Active Radiation
- units :
- MJ m⁻² day⁻¹
Array Chunk Bytes 109.66 MiB 19.17 MiB Shape (1096, 166, 158) (730, 85, 81) Dask graph 8 chunks in 14 graph layers Data type float32 numpy.ndarray - PET(time, y, x)float32dask.array<chunksize=(366, 86, 82), meta=np.ndarray>
- units :
- mm day⁻¹
- long_name :
- Reference evapotranspiration
Array Chunk Bytes 109.66 MiB 19.64 MiB Shape (1096, 166, 158) (730, 86, 82) Dask graph 8 chunks in 12 graph layers Data type float32 numpy.ndarray - T(time, y, x)float32dask.array<chunksize=(366, 85, 81), meta=np.ndarray>
- GRIB_paramId :
- 233253011
- GRIB_numberOfPoints :
- 258681
- GRIB_typeOfLevel :
- heightAboveGround
- GRIB_stepUnits :
- 1
- GRIB_stepType :
- instant
- GRIB_gridType :
- lambert
- GRIB_DxInMetres :
- 2500
- GRIB_DyInMetres :
- 2500
- GRIB_LaDInDegrees :
- 53.5
- GRIB_Latin1InDegrees :
- 53.5
- GRIB_Latin2InDegrees :
- 53.5
- GRIB_LoVInDegrees :
- 5.0
- GRIB_NV :
- 132
- GRIB_Nx :
- 529
- GRIB_Ny :
- 489
- GRIB_cfName :
- unknown
- GRIB_cfVarName :
- unknown
- GRIB_gridDefinitionDescription :
- Lambert Conformal
- GRIB_iScansNegatively :
- 0
- GRIB_jPointsAreConsecutive :
- 0
- GRIB_jScansPositively :
- 1
- GRIB_latitudeOfFirstGridPointInDegrees :
- 46.834
- GRIB_latitudeOfSouthernPoleInDegrees :
- 0.0
- GRIB_longitudeOfFirstGridPointInDegrees :
- -14.609
- GRIB_longitudeOfSouthernPoleInDegrees :
- 0.0
- GRIB_missingValue :
- 3.4028234663852886e+38
- GRIB_name :
- Temperature
- GRIB_shortName :
- t
- GRIB_units :
- K
- long_name :
- Temperature
- units :
- °C
- standard_name :
- unknown
Array Chunk Bytes 109.66 MiB 19.17 MiB Shape (1096, 166, 158) (730, 85, 81) Dask graph 8 chunks in 13 graph layers Data type float32 numpy.ndarray - PP(time, y, x)float32dask.array<chunksize=(366, 85, 81), meta=np.ndarray>
- GRIB_paramId :
- 233253061
- GRIB_numberOfPoints :
- 258681
- GRIB_typeOfLevel :
- heightAboveGround
- GRIB_stepUnits :
- 1
- GRIB_stepType :
- accum
- GRIB_gridType :
- lambert
- GRIB_DxInMetres :
- 2500
- GRIB_DyInMetres :
- 2500
- GRIB_LaDInDegrees :
- 53.5
- GRIB_Latin1InDegrees :
- 53.5
- GRIB_Latin2InDegrees :
- 53.5
- GRIB_LoVInDegrees :
- 5.0
- GRIB_NV :
- 132
- GRIB_Nx :
- 529
- GRIB_Ny :
- 489
- GRIB_cfName :
- unknown
- GRIB_cfVarName :
- unknown
- GRIB_gridDefinitionDescription :
- Lambert Conformal
- GRIB_iScansNegatively :
- 0
- GRIB_jPointsAreConsecutive :
- 0
- GRIB_jScansPositively :
- 1
- GRIB_latitudeOfFirstGridPointInDegrees :
- 46.834
- GRIB_latitudeOfSouthernPoleInDegrees :
- 0.0
- GRIB_longitudeOfFirstGridPointInDegrees :
- -14.609
- GRIB_longitudeOfSouthernPoleInDegrees :
- 0.0
- GRIB_missingValue :
- 3.4028234663852886e+38
- GRIB_name :
- Total precipitation
- GRIB_shortName :
- tp
- GRIB_units :
- kg m**-2
- long_name :
- Total precipitation
- units :
- mm day⁻¹
- standard_name :
- unknown
Array Chunk Bytes 109.66 MiB 19.17 MiB Shape (1096, 166, 158) (730, 85, 81) Dask graph 8 chunks in 13 graph layers Data type float32 numpy.ndarray
- xPandasIndex
PandasIndex(Float64Index([415000.0, 417500.0, 420000.0, 422500.0, 425000.0, 427500.0, 430000.0, 432500.0, 435000.0, 437500.0, ... 785000.0, 787500.0, 790000.0, 792500.0, 795000.0, 797500.0, 800000.0, 802500.0, 805000.0, 807500.0], dtype='float64', name='x', length=158)) - yPandasIndex
PandasIndex(Float64Index([407500.0, 410000.0, 412500.0, 415000.0, 417500.0, 420000.0, 422500.0, 425000.0, 427500.0, 430000.0, ... 797500.0, 800000.0, 802500.0, 805000.0, 807500.0, 810000.0, 812500.0, 815000.0, 817500.0, 820000.0], dtype='float64', name='y', length=166)) - timePandasIndex
PandasIndex(DatetimeIndex(['1980-01-01', '1980-01-02', '1980-01-03', '1980-01-04',
               '1980-01-05', '1980-01-06', '1980-01-07', '1980-01-08',
               '1980-01-09', '1980-01-10',
               ...
               '1982-12-22', '1982-12-23', '1982-12-24', '1982-12-25',
               '1982-12-26', '1982-12-27', '1982-12-28', '1982-12-29',
               '1982-12-30', '1982-12-31'],
              dtype='datetime64[ns]', name='time', length=1096, freq=None))
- CDI :
- Climate Data Interface version 2.0.5 (https://mpimet.mpg.de/cdi)
- Conventions :
- CF-1.6
- CDO :
- Climate Data Operators version 2.0.5 (https://mpimet.mpg.de/cdo)
- dataset :
- IE_MERA_FC3hr_3_day
# check value for the first day of the first year
ds.sel({"x": XLON, "y": YLAT}, method="nearest").isel(time=0)["T"].values
array(6.8350525, dtype=float32)
# check first value of spin-up year - should be nan
ds_interp.sel({"x": XLON, "y": YLAT}, method="nearest").isel(time=0)[
    "T"
].values
array(nan)
# shift first year of the main data to the spin-up year
ds_interp = ds_interp.shift(time=-ds_interp.sel(time="1980").dims["time"])
# check value for the first day of the first year
ds_interp.sel({"x": XLON, "y": YLAT}, method="nearest").isel(time=0)[
    "T"
].values
array(6.8350525, dtype=float32)
# keep only spin-up year
ds_interp = ds_interp.sel(time="1980")
# merge with main dataset
ds = xr.combine_by_coords([ds, ds_interp])
ds.rio.write_crs(data_crs, inplace=True)
<xarray.Dataset>
Dimensions:            (x: 158, y: 166, time: 9497)
Coordinates:
  * x                  (x) float64 4.15e+05 4.175e+05 ... 8.05e+05 8.075e+05
  * y                  (y) float64 4.075e+05 4.1e+05 ... 8.175e+05 8.2e+05
    height             float64 0.0
    Lambert_Conformal  int64 0
  * time               (time) datetime64[ns] 1980-01-01 ... 2005-12-31
    spatial_ref        int64 0
Data variables:
    PAR                (time, y, x) float32 dask.array<chunksize=(366, 85, 81), meta=np.ndarray>
    PET                (time, y, x) float32 dask.array<chunksize=(366, 86, 82), meta=np.ndarray>
    T                  (time, y, x) float32 dask.array<chunksize=(366, 85, 81), meta=np.ndarray>
    PP                 (time, y, x) float32 dask.array<chunksize=(366, 85, 81), meta=np.ndarray>
Attributes:
    CDI:          Climate Data Interface version 2.0.5 (https://mpimet.mpg.de...
    Conventions:  CF-1.6
    CDO:          Climate Data Operators version 2.0.5 (https://mpimet.mpg.de...
    dataset:      IE_MERA_FC3hr_3_day
xarray.Dataset
- x: 158
- y: 166
- time: 9497
- x(x)float644.15e+05 4.175e+05 ... 8.075e+05
- standard_name :
- projection_x_coordinate
- units :
- metre
- axis :
- X
- long_name :
- x coordinate of projection
array([415000., 417500., 420000., 422500., 425000., 427500., 430000., 432500., 435000., 437500., 440000., 442500., 445000., 447500., 450000., 452500., 455000., 457500., 460000., 462500., 465000., 467500., 470000., 472500., 475000., 477500., 480000., 482500., 485000., 487500., 490000., 492500., 495000., 497500., 500000., 502500., 505000., 507500., 510000., 512500., 515000., 517500., 520000., 522500., 525000., 527500., 530000., 532500., 535000., 537500., 540000., 542500., 545000., 547500., 550000., 552500., 555000., 557500., 560000., 562500., 565000., 567500., 570000., 572500., 575000., 577500., 580000., 582500., 585000., 587500., 590000., 592500., 595000., 597500., 600000., 602500., 605000., 607500., 610000., 612500., 615000., 617500., 620000., 622500., 625000., 627500., 630000., 632500., 635000., 637500., 640000., 642500., 645000., 647500., 650000., 652500., 655000., 657500., 660000., 662500., 665000., 667500., 670000., 672500., 675000., 677500., 680000., 682500., 685000., 687500., 690000., 692500., 695000., 697500., 700000., 702500., 705000., 707500., 710000., 712500., 715000., 717500., 720000., 722500., 725000., 727500., 730000., 732500., 735000., 737500., 740000., 742500., 745000., 747500., 750000., 752500., 755000., 757500., 760000., 762500., 765000., 767500., 770000., 772500., 775000., 777500., 780000., 782500., 785000., 787500., 790000., 792500., 795000., 797500., 800000., 802500., 805000., 807500.]) - y(y)float644.075e+05 4.1e+05 ... 8.2e+05
- standard_name :
- projection_y_coordinate
- units :
- metre
- axis :
- Y
- long_name :
- y coordinate of projection
array([407500., 410000., 412500., 415000., 417500., 420000., 422500., 425000., 427500., 430000., 432500., 435000., 437500., 440000., 442500., 445000., 447500., 450000., 452500., 455000., 457500., 460000., 462500., 465000., 467500., 470000., 472500., 475000., 477500., 480000., 482500., 485000., 487500., 490000., 492500., 495000., 497500., 500000., 502500., 505000., 507500., 510000., 512500., 515000., 517500., 520000., 522500., 525000., 527500., 530000., 532500., 535000., 537500., 540000., 542500., 545000., 547500., 550000., 552500., 555000., 557500., 560000., 562500., 565000., 567500., 570000., 572500., 575000., 577500., 580000., 582500., 585000., 587500., 590000., 592500., 595000., 597500., 600000., 602500., 605000., 607500., 610000., 612500., 615000., 617500., 620000., 622500., 625000., 627500., 630000., 632500., 635000., 637500., 640000., 642500., 645000., 647500., 650000., 652500., 655000., 657500., 660000., 662500., 665000., 667500., 670000., 672500., 675000., 677500., 680000., 682500., 685000., 687500., 690000., 692500., 695000., 697500., 700000., 702500., 705000., 707500., 710000., 712500., 715000., 717500., 720000., 722500., 725000., 727500., 730000., 732500., 735000., 737500., 740000., 742500., 745000., 747500., 750000., 752500., 755000., 757500., 760000., 762500., 765000., 767500., 770000., 772500., 775000., 777500., 780000., 782500., 785000., 787500., 790000., 792500., 795000., 797500., 800000., 802500., 805000., 807500., 810000., 812500., 815000., 817500., 820000.]) - height()float640.0
- standard_name :
- height
- long_name :
- height
- units :
- m
- positive :
- up
- axis :
- Z
array(0.)
- Lambert_Conformal()int640
- crs_wkt :
- PROJCS["undefined",GEOGCS["undefined",DATUM["undefined",SPHEROID["undefined",6367470,0]],PRIMEM["Greenwich",0,AUTHORITY["EPSG","8901"]],UNIT["degree",0.0174532925199433]],PROJECTION["Lambert_Conformal_Conic_1SP"],PARAMETER["latitude_of_origin",53.5],PARAMETER["central_meridian",5],PARAMETER["scale_factor",1],PARAMETER["false_easting",1481641.67696368],PARAMETER["false_northing",537326.063885016],UNIT["metre",1,AUTHORITY["EPSG","9001"]],AXIS["Easting",EAST],AXIS["Northing",NORTH]]
- semi_major_axis :
- 6367470.0
- semi_minor_axis :
- 6367470.0
- inverse_flattening :
- 0.0
- reference_ellipsoid_name :
- undefined
- longitude_of_prime_meridian :
- 0.0
- prime_meridian_name :
- Greenwich
- geographic_crs_name :
- undefined
- horizontal_datum_name :
- undefined
- projected_crs_name :
- undefined
- grid_mapping_name :
- lambert_conformal_conic
- standard_parallel :
- 53.5
- longitude_of_central_meridian :
- 5.0
- false_easting :
- 1481641.67696368
- false_northing :
- 537326.063885016
- spatial_ref :
- PROJCS["undefined",GEOGCS["undefined",DATUM["undefined",SPHEROID["undefined",6367470,0]],PRIMEM["Greenwich",0,AUTHORITY["EPSG","8901"]],UNIT["degree",0.0174532925199433]],PROJECTION["Lambert_Conformal_Conic_1SP"],PARAMETER["latitude_of_origin",53.5],PARAMETER["central_meridian",5],PARAMETER["scale_factor",1],PARAMETER["false_easting",1481641.67696368],PARAMETER["false_northing",537326.063885016],UNIT["metre",1,AUTHORITY["EPSG","9001"]],AXIS["Easting",EAST],AXIS["Northing",NORTH]]
- GeoTransform :
- 413750.0 2500.0 0.0 406250.0 0.0 2500.0
array(0)
- time(time)datetime64[ns]1980-01-01 ... 2005-12-31
- standard_name :
- time
- axis :
- T
array(['1980-01-01T00:00:00.000000000', '1980-01-02T00:00:00.000000000', '1980-01-03T00:00:00.000000000', ..., '2005-12-29T00:00:00.000000000', '2005-12-30T00:00:00.000000000', '2005-12-31T00:00:00.000000000'], dtype='datetime64[ns]') - spatial_ref()int640
- crs_wkt :
- PROJCS["undefined",GEOGCS["undefined",DATUM["undefined",SPHEROID["undefined",6367470,0]],PRIMEM["Greenwich",0,AUTHORITY["EPSG","8901"]],UNIT["degree",0.0174532925199433]],PROJECTION["Lambert_Conformal_Conic_1SP"],PARAMETER["latitude_of_origin",53.5],PARAMETER["central_meridian",5],PARAMETER["scale_factor",1],PARAMETER["false_easting",1481641.67696368],PARAMETER["false_northing",537326.063885016],UNIT["metre",1,AUTHORITY["EPSG","9001"]],AXIS["Easting",EAST],AXIS["Northing",NORTH]]
- semi_major_axis :
- 6367470.0
- semi_minor_axis :
- 6367470.0
- inverse_flattening :
- 0.0
- reference_ellipsoid_name :
- undefined
- longitude_of_prime_meridian :
- 0.0
- prime_meridian_name :
- Greenwich
- geographic_crs_name :
- undefined
- horizontal_datum_name :
- undefined
- projected_crs_name :
- undefined
- grid_mapping_name :
- lambert_conformal_conic
- standard_parallel :
- 53.5
- longitude_of_central_meridian :
- 5.0
- false_easting :
- 1481641.67696368
- false_northing :
- 537326.063885016
- spatial_ref :
- PROJCS["undefined",GEOGCS["undefined",DATUM["undefined",SPHEROID["undefined",6367470,0]],PRIMEM["Greenwich",0,AUTHORITY["EPSG","8901"]],UNIT["degree",0.0174532925199433]],PROJECTION["Lambert_Conformal_Conic_1SP"],PARAMETER["latitude_of_origin",53.5],PARAMETER["central_meridian",5],PARAMETER["scale_factor",1],PARAMETER["false_easting",1481641.67696368],PARAMETER["false_northing",537326.063885016],UNIT["metre",1,AUTHORITY["EPSG","9001"]],AXIS["Easting",EAST],AXIS["Northing",NORTH]]
- GeoTransform :
- 413750.0 2500.0 0.0 406250.0 0.0 2500.0
array(0)
- PAR(time, y, x)float32dask.array<chunksize=(366, 85, 81), meta=np.ndarray>
- long_name :
- Surface Photosynthetically Active Radiation
- units :
- MJ m⁻² day⁻¹
Array Chunk Bytes 0.93 GiB 127.93 MiB Shape (9497, 166, 158) (4871, 85, 81) Dask graph 12 chunks in 21 graph layers Data type float32 numpy.ndarray - PET(time, y, x)float32dask.array<chunksize=(366, 86, 82), meta=np.ndarray>
- units :
- mm day⁻¹
- long_name :
- Reference evapotranspiration
Array Chunk Bytes 0.93 GiB 127.94 MiB Shape (9497, 166, 158) (4756, 86, 82) Dask graph 12 chunks in 19 graph layers Data type float32 numpy.ndarray - T(time, y, x)float32dask.array<chunksize=(366, 85, 81), meta=np.ndarray>
- GRIB_paramId :
- 233253011
- GRIB_numberOfPoints :
- 258681
- GRIB_typeOfLevel :
- heightAboveGround
- GRIB_stepUnits :
- 1
- GRIB_stepType :
- instant
- GRIB_gridType :
- lambert
- GRIB_DxInMetres :
- 2500
- GRIB_DyInMetres :
- 2500
- GRIB_LaDInDegrees :
- 53.5
- GRIB_Latin1InDegrees :
- 53.5
- GRIB_Latin2InDegrees :
- 53.5
- GRIB_LoVInDegrees :
- 5.0
- GRIB_NV :
- 132
- GRIB_Nx :
- 529
- GRIB_Ny :
- 489
- GRIB_cfName :
- unknown
- GRIB_cfVarName :
- unknown
- GRIB_gridDefinitionDescription :
- Lambert Conformal
- GRIB_iScansNegatively :
- 0
- GRIB_jPointsAreConsecutive :
- 0
- GRIB_jScansPositively :
- 1
- GRIB_latitudeOfFirstGridPointInDegrees :
- 46.834
- GRIB_latitudeOfSouthernPoleInDegrees :
- 0.0
- GRIB_longitudeOfFirstGridPointInDegrees :
- -14.609
- GRIB_longitudeOfSouthernPoleInDegrees :
- 0.0
- GRIB_missingValue :
- 3.4028234663852886e+38
- GRIB_name :
- Temperature
- GRIB_shortName :
- t
- GRIB_units :
- K
- long_name :
- Temperature
- units :
- °C
- standard_name :
- unknown
Array Chunk Bytes 0.93 GiB 127.93 MiB Shape (9497, 166, 158) (4871, 85, 81) Dask graph 12 chunks in 20 graph layers Data type float32 numpy.ndarray - PP(time, y, x)float32dask.array<chunksize=(366, 85, 81), meta=np.ndarray>
- GRIB_paramId :
- 233253061
- GRIB_numberOfPoints :
- 258681
- GRIB_typeOfLevel :
- heightAboveGround
- GRIB_stepUnits :
- 1
- GRIB_stepType :
- accum
- GRIB_gridType :
- lambert
- GRIB_DxInMetres :
- 2500
- GRIB_DyInMetres :
- 2500
- GRIB_LaDInDegrees :
- 53.5
- GRIB_Latin1InDegrees :
- 53.5
- GRIB_Latin2InDegrees :
- 53.5
- GRIB_LoVInDegrees :
- 5.0
- GRIB_NV :
- 132
- GRIB_Nx :
- 529
- GRIB_Ny :
- 489
- GRIB_cfName :
- unknown
- GRIB_cfVarName :
- unknown
- GRIB_gridDefinitionDescription :
- Lambert Conformal
- GRIB_iScansNegatively :
- 0
- GRIB_jPointsAreConsecutive :
- 0
- GRIB_jScansPositively :
- 1
- GRIB_latitudeOfFirstGridPointInDegrees :
- 46.834
- GRIB_latitudeOfSouthernPoleInDegrees :
- 0.0
- GRIB_longitudeOfFirstGridPointInDegrees :
- -14.609
- GRIB_longitudeOfSouthernPoleInDegrees :
- 0.0
- GRIB_missingValue :
- 3.4028234663852886e+38
- GRIB_name :
- Total precipitation
- GRIB_shortName :
- tp
- GRIB_units :
- kg m**-2
- long_name :
- Total precipitation
- units :
- mm day⁻¹
- standard_name :
- unknown
Array Chunk Bytes 0.93 GiB 127.93 MiB Shape (9497, 166, 158) (4871, 85, 81) Dask graph 12 chunks in 20 graph layers Data type float32 numpy.ndarray
- xPandasIndex
PandasIndex(Float64Index([415000.0, 417500.0, 420000.0, 422500.0, 425000.0, 427500.0, 430000.0, 432500.0, 435000.0, 437500.0, ... 785000.0, 787500.0, 790000.0, 792500.0, 795000.0, 797500.0, 800000.0, 802500.0, 805000.0, 807500.0], dtype='float64', name='x', length=158)) - yPandasIndex
PandasIndex(Float64Index([407500.0, 410000.0, 412500.0, 415000.0, 417500.0, 420000.0, 422500.0, 425000.0, 427500.0, 430000.0, ... 797500.0, 800000.0, 802500.0, 805000.0, 807500.0, 810000.0, 812500.0, 815000.0, 817500.0, 820000.0], dtype='float64', name='y', length=166)) - timePandasIndex
PandasIndex(DatetimeIndex(['1980-01-01', '1980-01-02', '1980-01-03', '1980-01-04',
               '1980-01-05', '1980-01-06', '1980-01-07', '1980-01-08',
               '1980-01-09', '1980-01-10',
               ...
               '2005-12-22', '2005-12-23', '2005-12-24', '2005-12-25',
               '2005-12-26', '2005-12-27', '2005-12-28', '2005-12-29',
               '2005-12-30', '2005-12-31'],
              dtype='datetime64[ns]', name='time', length=9497, freq=None))
- CDI :
- Climate Data Interface version 2.0.5 (https://mpimet.mpg.de/cdi)
- Conventions :
- CF-1.6
- CDO :
- Climate Data Operators version 2.0.5 (https://mpimet.mpg.de/cdo)
- dataset :
- IE_MERA_FC3hr_3_day
# visualise
# spin-up year and first year should be identical
ds_interp = ds.sel({"x": XLON, "y": YLAT}, method="nearest").sel(
    time=slice("1980", "1982")
)
plt.figure(figsize=(12, 4))
plt.plot(ds_interp["time"], ds_interp["T"])
plt.title(f"{ds['T'].attrs['long_name']} [{ds['T'].attrs['units']}]")
plt.tight_layout()
plt.show()