Gridding agricultural census data - EURO-CORDEX#
Gridding based on https://james-brennan.github.io/posts/fast_gridding_geopandas/
import os
import itertools
import geopandas as gpd
import matplotlib.pyplot as plt
import numpy as np
import shapely
import xarray as xr
import climag.climag as cplt
Open some gridded climate data#
TS_FILE = os.path.join(
    "data", "EURO-CORDEX", "IE", "IE_EURO-CORDEX_RCA4_EC-EARTH_rcp45.nc"
)
data = xr.open_dataset(TS_FILE, chunks="auto", decode_coords="all")
data
<xarray.Dataset>
Dimensions:       (rlat: 33, rlon: 37, time: 11323, bnds: 2)
Coordinates:
    lat           (rlat, rlon) float64 dask.array<chunksize=(33, 37), meta=np.ndarray>
    lon           (rlat, rlon) float64 dask.array<chunksize=(33, 37), meta=np.ndarray>
  * rlat          (rlat) float64 3.685 3.795 3.905 4.015 ... 6.985 7.095 7.205
  * rlon          (rlon) float64 -17.27 -17.16 -17.05 ... -13.53 -13.41 -13.3
  * time          (time) datetime64[ns] 2040-01-01T12:00:00 ... 2070-12-31T12...
    height        float64 ...
    rotated_pole  |S1 ...
    time_bnds     (time, bnds) datetime64[ns] dask.array<chunksize=(11323, 2), meta=np.ndarray>
    spatial_ref   int64 ...
Dimensions without coordinates: bnds
Data variables:
    PET           (time, rlat, rlon) float32 dask.array<chunksize=(11323, 33, 37), meta=np.ndarray>
    PP            (time, rlat, rlon) float32 dask.array<chunksize=(11323, 33, 37), meta=np.ndarray>
    T             (time, rlat, rlon) float32 dask.array<chunksize=(11323, 33, 37), meta=np.ndarray>
    PAR           (time, rlat, rlon) float32 dask.array<chunksize=(11323, 33, 37), meta=np.ndarray>
Attributes: (12/24)
    Conventions:                    CF-1.4
    contact:                        rossby.cordex@smhi.se
    creation_date:                  2013-07-08-T12:54:04Z
    experiment:                     RCP4.5
    experiment_id:                  rcp45
    driving_experiment:             ICHEC-EC-EARTH, rcp45, r12i1p1
    ...                             ...
    tracking_id:                    0646d817-8046-4c9b-b02b-b9e5feb3325c
    rossby_comment:                 201138: CORDEX Europe 0.11 deg | RCA4 v1 ...
    rossby_run_id:                  201138
    rossby_grib_path:               /nobackup/rossby16/rossby/joint_exp/corde...
    dataset:                        IE_EURO-CORDEX_RCA4_EC-EARTH_rcp45
comment: This dataset has been clipped with the Is...# keep only one variable
data = data.drop_vars(names=["PET", "PP", "PAR"])
data
<xarray.Dataset>
Dimensions:       (rlat: 33, rlon: 37, time: 11323, bnds: 2)
Coordinates:
    lat           (rlat, rlon) float64 dask.array<chunksize=(33, 37), meta=np.ndarray>
    lon           (rlat, rlon) float64 dask.array<chunksize=(33, 37), meta=np.ndarray>
  * rlat          (rlat) float64 3.685 3.795 3.905 4.015 ... 6.985 7.095 7.205
  * rlon          (rlon) float64 -17.27 -17.16 -17.05 ... -13.53 -13.41 -13.3
  * time          (time) datetime64[ns] 2040-01-01T12:00:00 ... 2070-12-31T12...
    height        float64 ...
    rotated_pole  |S1 ...
    time_bnds     (time, bnds) datetime64[ns] dask.array<chunksize=(11323, 2), meta=np.ndarray>
    spatial_ref   int64 ...
Dimensions without coordinates: bnds
Data variables:
    T             (time, rlat, rlon) float32 dask.array<chunksize=(11323, 33, 37), meta=np.ndarray>
Attributes: (12/24)
    Conventions:                    CF-1.4
    contact:                        rossby.cordex@smhi.se
    creation_date:                  2013-07-08-T12:54:04Z
    experiment:                     RCP4.5
    experiment_id:                  rcp45
    driving_experiment:             ICHEC-EC-EARTH, rcp45, r12i1p1
    ...                             ...
    tracking_id:                    0646d817-8046-4c9b-b02b-b9e5feb3325c
    rossby_comment:                 201138: CORDEX Europe 0.11 deg | RCA4 v1 ...
    rossby_run_id:                  201138
    rossby_grib_path:               /nobackup/rossby16/rossby/joint_exp/corde...
    dataset:                        IE_EURO-CORDEX_RCA4_EC-EARTH_rcp45
comment: This dataset has been clipped with the Is...# copy CRS
crs = data.rio.crs
crs
CRS.from_wkt('GEOGCRS["undefined",BASEGEOGCRS["undefined",DATUM["World Geodetic System 1984",ELLIPSOID["WGS 84",6378137,298.257223563,LENGTHUNIT["metre",1]],ID["EPSG",6326]],PRIMEM["Greenwich",0,ANGLEUNIT["degree",0.0174532925199433],ID["EPSG",8901]]],DERIVINGCONVERSION["Pole rotation (netCDF CF convention)",METHOD["Pole rotation (netCDF CF convention)"],PARAMETER["Grid north pole latitude (netCDF CF convention)",39.25,ANGLEUNIT["degree",0.0174532925199433,ID["EPSG",9122]]],PARAMETER["Grid north pole longitude (netCDF CF convention)",-162,ANGLEUNIT["degree",0.0174532925199433,ID["EPSG",9122]]],PARAMETER["North pole grid longitude (netCDF CF convention)",0,ANGLEUNIT["degree",0.0174532925199433,ID["EPSG",9122]]]],CS[ellipsoidal,2],AXIS["longitude",east,ORDER[1],ANGLEUNIT["degree",0.0174532925199433,ID["EPSG",9122]]],AXIS["latitude",north,ORDER[2],ANGLEUNIT["degree",0.0174532925199433,ID["EPSG",9122]]]]')
Use the gridded data’s bounds to generate a gridded vector layer#
data.rio.bounds()
(-17.32, 3.6299999999999986, -13.25, 7.260000000000002)
xmin, ymin, xmax, ymax = data.rio.bounds()
# the difference between two adjacent rotated lat or lon values is the
# cell size
cell_size = float(data["rlat"][1] - data["rlat"][0])
# create the cells in a loop
grid_cells = []
for x0 in np.arange(xmin, xmax + cell_size, cell_size):
    for y0 in np.arange(ymin, ymax + cell_size, cell_size):
        # bounds
        x1 = x0 - cell_size
        y1 = y0 + cell_size
        grid_cells.append(shapely.geometry.box(x0, y0, x1, y1))
grid_cells = gpd.GeoDataFrame(grid_cells, columns=["geometry"], crs=crs)
grid_cells.shape
(1292, 1)
grid_cells.head()
| geometry | |
|---|---|
| 0 | POLYGON ((-17.43000 3.63000, -17.43000 3.74000... |
| 1 | POLYGON ((-17.43000 3.74000, -17.43000 3.85000... |
| 2 | POLYGON ((-17.43000 3.85000, -17.43000 3.96000... |
| 3 | POLYGON ((-17.43000 3.96000, -17.43000 4.07000... |
| 4 | POLYGON ((-17.43000 4.07000, -17.43000 4.18000... |
grid_cells.crs
<Derived Geographic 2D CRS: GEOGCRS["undefined",BASEGEOGCRS["undefined",DATUM[ ...>
Name: undefined
Axis Info [ellipsoidal]:
- lon[east]: Longitude (degree)
- lat[north]: Latitude (degree)
Area of Use:
- undefined
Coordinate Operation:
- name: Pole rotation (netCDF CF convention)
- method: Pole rotation (netCDF CF convention)
Datum: World Geodetic System 1984
- Ellipsoid: WGS 84
- Prime Meridian: Greenwich
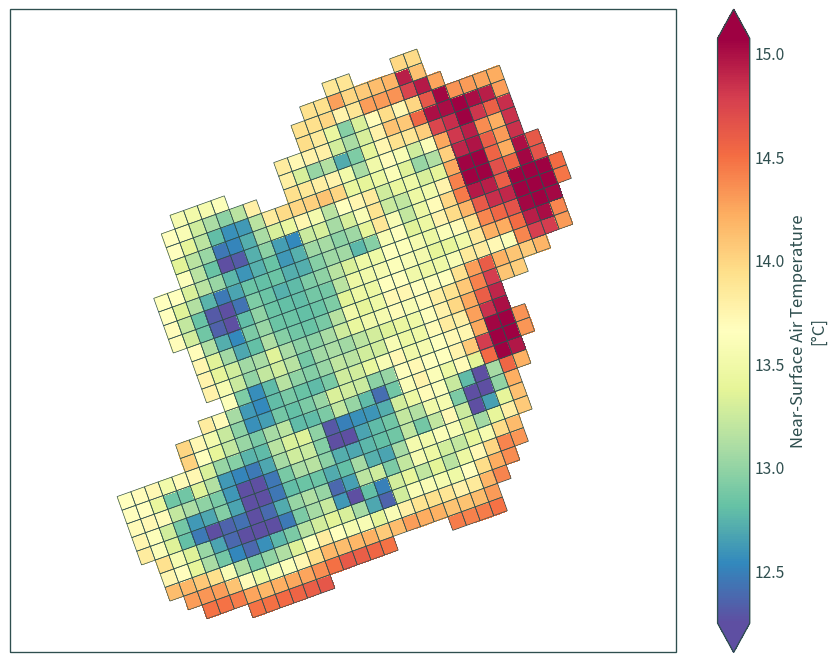
Subset climate data to visualise the cells#
data_ = data.sel(time="2041-06-21")
data_
<xarray.Dataset>
Dimensions:       (rlat: 33, rlon: 37, time: 1, bnds: 2)
Coordinates:
    lat           (rlat, rlon) float64 dask.array<chunksize=(33, 37), meta=np.ndarray>
    lon           (rlat, rlon) float64 dask.array<chunksize=(33, 37), meta=np.ndarray>
  * rlat          (rlat) float64 3.685 3.795 3.905 4.015 ... 6.985 7.095 7.205
  * rlon          (rlon) float64 -17.27 -17.16 -17.05 ... -13.53 -13.41 -13.3
  * time          (time) datetime64[ns] 2041-06-21T12:00:00
    height        float64 ...
    rotated_pole  |S1 ...
    time_bnds     (time, bnds) datetime64[ns] dask.array<chunksize=(1, 2), meta=np.ndarray>
    spatial_ref   int64 ...
Dimensions without coordinates: bnds
Data variables:
    T             (time, rlat, rlon) float32 dask.array<chunksize=(1, 33, 37), meta=np.ndarray>
Attributes: (12/24)
    Conventions:                    CF-1.4
    contact:                        rossby.cordex@smhi.se
    creation_date:                  2013-07-08-T12:54:04Z
    experiment:                     RCP4.5
    experiment_id:                  rcp45
    driving_experiment:             ICHEC-EC-EARTH, rcp45, r12i1p1
    ...                             ...
    tracking_id:                    0646d817-8046-4c9b-b02b-b9e5feb3325c
    rossby_comment:                 201138: CORDEX Europe 0.11 deg | RCA4 v1 ...
    rossby_run_id:                  201138
    rossby_grib_path:               /nobackup/rossby16/rossby/joint_exp/corde...
    dataset:                        IE_EURO-CORDEX_RCA4_EC-EARTH_rcp45
comment: This dataset has been clipped with the Is...# find number of grid cells with data
len(data_["T"].values.flatten()[np.isfinite(data_["T"].values.flatten())])
765
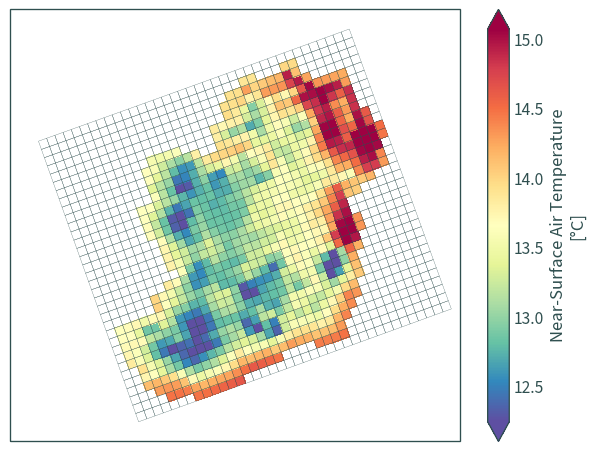
plot_transform = cplt.rotated_pole_transform(data_)
# plt.figure(figsize=(9, 7))
axs = plt.axes(projection=cplt.projection_hiresireland)

# plot data for the variable
data_["T"].plot(
    ax=axs,
    cmap="Spectral_r",
    x="rlon",
    y="rlat",
    robust=True,
    transform=plot_transform,
)
grid_cells.to_crs(cplt.projection_hiresireland).boundary.plot(
    ax=axs, color="darkslategrey", linewidth=0.2
)

axs.set_title(None)
plt.axis("equal")
plt.tight_layout()
plt.show()
Drop grid cells without climate data#
grid_centroids = {"wkt": [], "rlon": [], "rlat": []}

for rlon, rlat in itertools.product(
    range(len(data.coords["rlon"])), range(len(data.coords["rlat"]))
):
    data__ = data.isel(rlon=rlon, rlat=rlat)

    # ignore null cells
    if not data__["T"].isnull().all():
        grid_centroids["wkt"].append(
            f"POINT ({float(data__['rlon'].values)} "
            f"{float(data__['rlat'].values)})"
        )
        grid_centroids["rlon"].append(float(data__["rlon"].values))
        grid_centroids["rlat"].append(float(data__["rlat"].values))
grid_centroids = gpd.GeoDataFrame(
    grid_centroids,
    geometry=gpd.GeoSeries.from_wkt(grid_centroids["wkt"], crs=crs),
)
grid_centroids.head()
| wkt | rlon | rlat | geometry | |
|---|---|---|---|---|
| 0 | POINT (-17.265 4.344999999999999) | -17.265 | 4.345 | POINT (-17.26500 4.34500) |
| 1 | POINT (-17.265 4.455000000000002) | -17.265 | 4.455 | POINT (-17.26500 4.45500) |
| 2 | POINT (-17.265 4.565000000000001) | -17.265 | 4.565 | POINT (-17.26500 4.56500) |
| 3 | POINT (-17.265 4.675000000000001) | -17.265 | 4.675 | POINT (-17.26500 4.67500) |
| 4 | POINT (-17.265 4.785) | -17.265 | 4.785 | POINT (-17.26500 4.78500) |
grid_centroids.shape
(765, 4)
grid_centroids.crs
<Derived Geographic 2D CRS: GEOGCRS["undefined",BASEGEOGCRS["undefined",DATUM[ ...>
Name: undefined
Axis Info [ellipsoidal]:
- lon[east]: Longitude (degree)
- lat[north]: Latitude (degree)
Area of Use:
- undefined
Coordinate Operation:
- name: Pole rotation (netCDF CF convention)
- method: Pole rotation (netCDF CF convention)
Datum: World Geodetic System 1984
- Ellipsoid: WGS 84
- Prime Meridian: Greenwich
grid_cells = gpd.sjoin(grid_cells, grid_centroids.to_crs(grid_cells.crs))
grid_cells.drop(columns=["wkt", "index_right"], inplace=True)
grid_cells.head()
| geometry | rlon | rlat | |
|---|---|---|---|
| 40 | POLYGON ((-17.32000 4.29000, -17.32000 4.40000... | -17.265 | 4.345 |
| 41 | POLYGON ((-17.32000 4.40000, -17.32000 4.51000... | -17.265 | 4.455 |
| 42 | POLYGON ((-17.32000 4.51000, -17.32000 4.62000... | -17.265 | 4.565 |
| 43 | POLYGON ((-17.32000 4.62000, -17.32000 4.73000... | -17.265 | 4.675 |
| 44 | POLYGON ((-17.32000 4.73000, -17.32000 4.84000... | -17.265 | 4.785 |
grid_cells.shape
(765, 3)
# plt.figure(figsize=(9, 7))
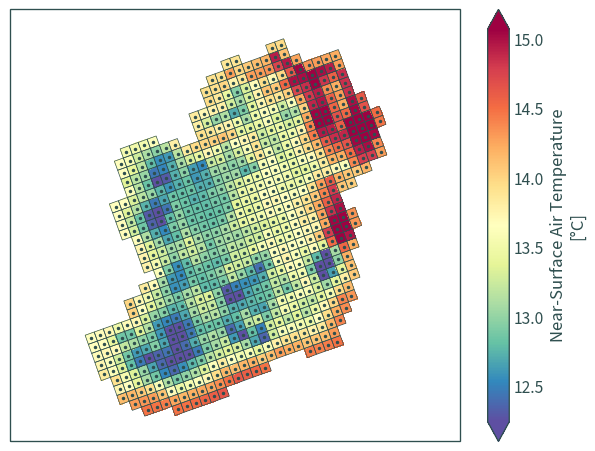
axs = plt.axes(projection=cplt.projection_hiresireland)
# plot data for the variable
data_["T"].plot(
ax=axs,
cmap="Spectral_r",
x="rlon",
y="rlat",
robust=True,
transform=plot_transform,
)
grid_cells.to_crs(cplt.projection_hiresireland).plot(
ax=axs, edgecolor="darkslategrey", facecolor="none", linewidth=0.5
)
grid_centroids.to_crs(cplt.projection_hiresireland).plot(
ax=axs, color="darkslategrey", markersize=2.5
)
axs.set_title(None)
plt.axis("equal")
plt.tight_layout()
plt.show()
Read stocking rate data#
stocking_rate = gpd.read_file(
    os.path.join("data", "agricultural_census", "agricultural_census.gpkg"),
    layer="stocking_rate",
)
stocking_rate.crs
<Derived Projected CRS: EPSG:2157>
Name: IRENET95 / Irish Transverse Mercator
Axis Info [cartesian]:
- E[east]: Easting (metre)
- N[north]: Northing (metre)
Area of Use:
- name: Ireland - onshore. United Kingdom (UK) - Northern Ireland (Ulster) - onshore.
- bounds: (-10.56, 51.39, -5.34, 55.43)
Coordinate Operation:
- name: Irish Transverse Mercator
- method: Transverse Mercator
Datum: IRENET95
- Ellipsoid: GRS 1980
- Prime Meridian: Greenwich
stocking_rate.head()
| ENGLISH | COUNTY | PROVINCE | GUID | total_cattle | total_sheep | total_grass_hectares | electoral_division | WD22CD | WD22NM | ward_2014_name | stocking_rate | geometry | |
|---|---|---|---|---|---|---|---|---|---|---|---|---|---|
| 0 | TURNAPIN | DUBLIN | Leinster | 2ae19629-1cea-13a3-e055-000000000001 | 0.0 | 0.0 | 0.0 | Turnapin, Co.Dublin, 04042 | 0 | 0 | 0 | 0.000000 | POLYGON ((717716.712 741601.510, 717759.461 74... |
| 1 | DRUMLUMMAN | CAVAN | Ulster | 2ae19629-1caa-13a3-e055-000000000001 | 2673.0 | 231.0 | 1249.1 | Drumlumman, Co.Cavan, 32089 | 0 | 0 | 0 | 1.730446 | POLYGON ((637756.185 787640.988, 637753.646 78... |
| 2 | CASTLEFORE | LEITRIM | Connacht | 2ae19629-171c-13a3-e055-000000000001 | 630.0 | 0.0 | 805.9 | Castlefore, Co.Leitrim, 28063 | 0 | 0 | 0 | 0.625388 | POLYGON ((608196.069 807618.950, 608244.536 80... |
| 3 | RAHONA | CLARE | Munster | 2ae19629-1fec-13a3-e055-000000000001 | 2369.0 | 0.0 | 1349.9 | Rahona, Co.Clare, 16101 | 0 | 0 | 0 | 1.403956 | POLYGON ((484212.068 651795.629, 484231.866 65... |
| 4 | CROSSAKEEL | MEATH | Leinster | 2ae19629-1861-13a3-e055-000000000001 | 4826.0 | 671.0 | 2014.1 | Crossakeel, Co.Meath, 11061 | 0 | 0 | 0 | 1.950201 | POLYGON ((663308.409 776111.796, 663305.294 77... |
stocking_rate.shape
(3917, 13)
stocking_rate["stocking_rate"].max()
5.627624825011666
stocking_rate["stocking_rate"].min()
0.0
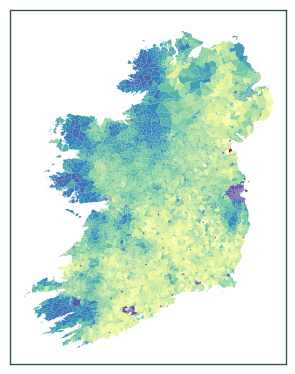
stocking_rate.plot(column="stocking_rate", cmap="Spectral_r")
plt.tick_params(labelbottom=False, labelleft=False)
plt.show()
Reproject cells to the CRS of the stocking rate data#
# use a projected CRS (e.g. 2157) instead of a geographical CRS (e.g. 4326)
grid_cells = grid_cells.to_crs(stocking_rate.crs)
grid_cells.head()
| geometry | rlon | rlat | |
|---|---|---|---|
| 40 | POLYGON ((419870.326 550490.054, 415715.725 56... | -17.265 | 4.345 |
| 41 | POLYGON ((415715.725 562009.785, 411561.600 57... | -17.265 | 4.455 |
| 42 | POLYGON ((411561.600 573530.159, 407407.964 58... | -17.265 | 4.565 |
| 43 | POLYGON ((407407.964 585051.187, 403254.829 59... | -17.265 | 4.675 |
| 44 | POLYGON ((403254.829 596572.878, 399102.207 60... | -17.265 | 4.785 |
axs = stocking_rate.plot(column="stocking_rate", cmap="Spectral_r")
grid_cells.boundary.plot(color="darkslategrey", linewidth=0.5, ax=axs)
axs.tick_params(labelbottom=False, labelleft=False)
plt.show()

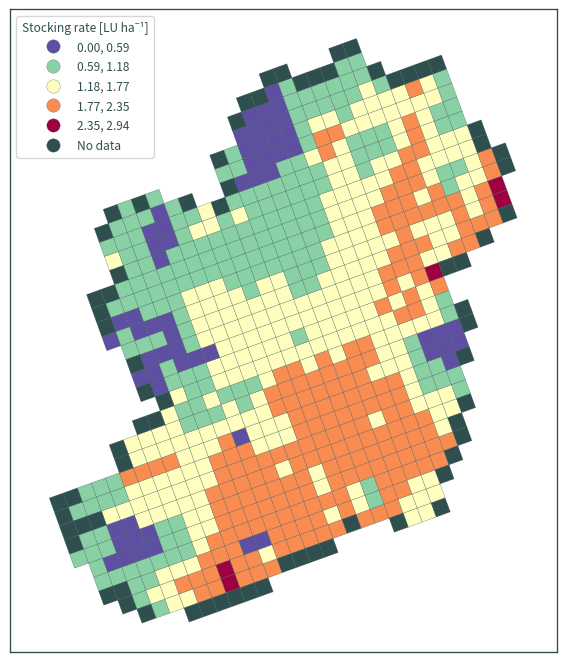
Create gridded stocking rate data#
merged = gpd.sjoin(stocking_rate, grid_cells, how="left")
merged.head()
| ENGLISH | COUNTY | PROVINCE | GUID | total_cattle | total_sheep | total_grass_hectares | electoral_division | WD22CD | WD22NM | ward_2014_name | stocking_rate | geometry | index_right | rlon | rlat | |
|---|---|---|---|---|---|---|---|---|---|---|---|---|---|---|---|---|
| 0 | TURNAPIN | DUBLIN | Leinster | 2ae19629-1cea-13a3-e055-000000000001 | 0.0 | 0.0 | 0.0 | Turnapin, Co.Dublin, 04042 | 0 | 0 | 0 | 0.000000 | POLYGON ((717716.712 741601.510, 717759.461 74... | 998 | -14.185 | 5.005 |
| 1 | DRUMLUMMAN | CAVAN | Ulster | 2ae19629-1caa-13a3-e055-000000000001 | 2673.0 | 231.0 | 1249.1 | Drumlumman, Co.Cavan, 32089 | 0 | 0 | 0 | 1.730446 | POLYGON ((637756.185 787640.988, 637753.646 78... | 834 | -14.735 | 5.665 |
| 2 | CASTLEFORE | LEITRIM | Connacht | 2ae19629-171c-13a3-e055-000000000001 | 630.0 | 0.0 | 805.9 | Castlefore, Co.Leitrim, 28063 | 0 | 0 | 0 | 0.625388 | POLYGON ((608196.069 807618.950, 608244.536 80... | 768 | -14.955 | 5.885 |
| 2 | CASTLEFORE | LEITRIM | Connacht | 2ae19629-171c-13a3-e055-000000000001 | 630.0 | 0.0 | 805.9 | Castlefore, Co.Leitrim, 28063 | 0 | 0 | 0 | 0.625388 | POLYGON ((608196.069 807618.950, 608244.536 80... | 769 | -14.955 | 5.995 |
| 3 | RAHONA | CLARE | Munster | 2ae19629-1fec-13a3-e055-000000000001 | 2369.0 | 0.0 | 1349.9 | Rahona, Co.Clare, 16101 | 0 | 0 | 0 | 1.403956 | POLYGON ((484212.068 651795.629, 484231.866 65... | 249 | -16.605 | 4.895 |
merged.shape
(8403, 16)
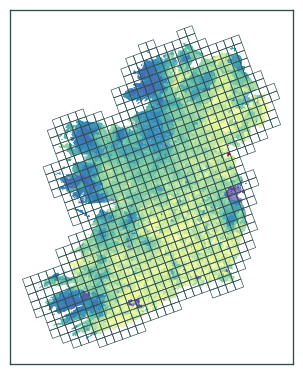
axs = merged.plot(column="stocking_rate", cmap="Spectral_r")
grid_cells.boundary.plot(color="darkslategrey", linewidth=0.5, ax=axs)
axs.tick_params(labelbottom=False, labelleft=False)
plt.show()
# compute stats per grid cell, use the mean stocking rate
dissolve = merged[["stocking_rate", "index_right", "geometry"]].dissolve(
    by="index_right", aggfunc=np.mean
)
dissolve.shape
(691, 2)
dissolve.head()
| geometry | stocking_rate | |
|---|---|---|
| index_right | ||
| 40 | MULTIPOLYGON (((424582.660 560554.883, 424573.... | 0.763591 |
| 72 | MULTIPOLYGON (((444183.052 537759.340, 444191.... | 1.091547 |
| 73 | MULTIPOLYGON (((444720.334 556193.935, 444722.... | 0.606959 |
| 74 | MULTIPOLYGON (((424582.660 560554.883, 424573.... | 0.686445 |
| 75 | MULTIPOLYGON (((424573.377 560561.357, 424570.... | 0.910934 |
len(dissolve.index.unique())
691
# merge with cell data
grid_cells.loc[dissolve.index, "sr"] = dissolve["stocking_rate"].values
grid_cells.head()
| geometry | rlon | rlat | sr | |
|---|---|---|---|---|
| 40 | POLYGON ((419870.326 550490.054, 415715.725 56... | -17.265 | 4.345 | 0.763591 |
| 41 | POLYGON ((415715.725 562009.785, 411561.600 57... | -17.265 | 4.455 | NaN |
| 42 | POLYGON ((411561.600 573530.159, 407407.964 58... | -17.265 | 4.565 | NaN |
| 43 | POLYGON ((407407.964 585051.187, 403254.829 59... | -17.265 | 4.675 | NaN |
| 44 | POLYGON ((403254.829 596572.878, 399102.207 60... | -17.265 | 4.785 | NaN |
grid_cells.shape
(765, 4)
len(grid_cells["geometry"].unique())
765
grid_cells["sr"].max()
2.9436027416019805
grid_cells["sr"].min()
0.0
plt.figure(figsize=(9, 7))
axs = plt.axes(projection=cplt.projection_hiresireland)

# plot data for the variable
data_["T"].plot(
    ax=axs,
    cmap="Spectral_r",
    x="rlon",
    y="rlat",
    robust=True,
    transform=plot_transform,
)

grid_cells.to_crs(cplt.projection_hiresireland).plot(
    ax=axs, edgecolor="darkslategrey", facecolor="none", linewidth=0.5
)

axs.set_title(None)
plt.axis("equal")
plt.tight_layout()
plt.show()
axs = grid_cells.plot(
    column="sr",
    cmap="Spectral_r",
    scheme="equal_interval",
    edgecolor="darkslategrey",
    linewidth=0.2,
    figsize=(6, 7),
    legend=True,
    legend_kwds={
        "loc": "upper left",
        "fmt": "{:.2f}",
        "title": "Stocking rate [LU ha⁻¹]",
    },
    missing_kwds={
        "color": "darkslategrey",
        "edgecolor": "darkslategrey",
        "label": "No data",
    },
)
for legend_handle in axs.get_legend().legend_handles:
    legend_handle.set_markeredgewidth(0.2)
    legend_handle.set_markeredgecolor("darkslategrey")
axs.tick_params(labelbottom=False, labelleft=False)
plt.axis("equal")
plt.tight_layout()
plt.show()
# fill no data with min value
grid_cells["sr"] = grid_cells["sr"].fillna(grid_cells["sr"].min())
grid_cells.head()
| geometry | rlon | rlat | sr | |
|---|---|---|---|---|
| 40 | POLYGON ((419870.326 550490.054, 415715.725 56... | -17.265 | 4.345 | 0.763591 |
| 41 | POLYGON ((415715.725 562009.785, 411561.600 57... | -17.265 | 4.455 | 0.000000 |
| 42 | POLYGON ((411561.600 573530.159, 407407.964 58... | -17.265 | 4.565 | 0.000000 |
| 43 | POLYGON ((407407.964 585051.187, 403254.829 59... | -17.265 | 4.675 | 0.000000 |
| 44 | POLYGON ((403254.829 596572.878, 399102.207 60... | -17.265 | 4.785 | 0.000000 |
axs = grid_cells.plot(
    column="sr",
    cmap="Spectral_r",
    scheme="equal_interval",
    edgecolor="darkslategrey",
    linewidth=0.2,
    figsize=(6, 7),
    legend=True,
    legend_kwds={
        "loc": "upper left",
        "fmt": "{:.2f}",
        "title": "Stocking rate [LU ha⁻¹]",
    },
    missing_kwds={
        "color": "darkslategrey",
        "edgecolor": "darkslategrey",
        "label": "No data",
    },
)
for legend_handle in axs.get_legend().legend_handles:
    legend_handle.set_markeredgewidth(0.2)
    legend_handle.set_markeredgecolor("darkslategrey")
axs.tick_params(labelbottom=False, labelleft=False)
plt.axis("equal")
plt.tight_layout()
plt.show()

grid_cells.to_file(
    os.path.join("data", "ModVege", "params.gpkg"), layer="eurocordex"
)