GrassCheck NI#
https://agrisearch.org/grasscheck
Huson, K. M., Lively, F. O., Aubry, A., Takahashi, T., Gordon, A. and McDonnell, D. A. (2020). ‘GrassCheck: monitoring grass growth and maximizing grass utilisation on UK farms’, in Virkajärvi, P. et al. (eds), Meeting the future demands for grassland production, Grassland Science in Europe, Helsinki, Finland, European Grassland Federation, vol. 25, pp. 716-718. [Online]. Available at https://www.europeangrassland.org/fileadmin/documents/Infos/Printed_Matter/Proceedings/EGF2020.pdf (Accessed 13 September 2022).
import os
from datetime import datetime, timezone
import matplotlib.pyplot as plt
import pandas as pd
DATA_DIR = os.path.join(
    "data", "grass_growth", "GrassCheckNI", "grasscheck.ods"
)
grass_ts = pd.read_excel(DATA_DIR, parse_dates=["week"])
# rename column
grass_ts.rename(columns={"week": "time"}, inplace=True)
grass_ts.head()
| time | derry | antrim | down | armagh | fermanagh | tyrone | |
|---|---|---|---|---|---|---|---|
| 0 | 2017-04-03 | 26.7 | 17.7 | 24.4 | 17.8 | 27.4 | 18.9 |
| 1 | 2017-04-10 | 36.0 | 30.0 | 39.0 | 42.0 | 37.0 | 27.0 |
| 2 | 2017-04-17 | 38.4 | 54.8 | 41.1 | 47.7 | 47.5 | 42.3 |
| 3 | 2017-04-24 | 56.0 | 52.0 | 55.0 | 53.0 | 56.0 | 56.0 |
| 4 | 2017-05-01 | 35.8 | 35.7 | 63.7 | 73.4 | 36.0 | 55.1 |
grass_ts.shape
(185, 7)
# use weekly time series starting on Monday to fill missing rows
grass_ = pd.DataFrame(
    pd.date_range(
        str(grass_ts["time"][0].year) + "-01-01",
        str(grass_ts["time"][len(grass_ts) - 1].year) + "-12-31",
        freq="W-MON",
    ),
    columns=["time"],
)
grass_ts = pd.merge(grass_, grass_ts, how="outer")
grass_ts.head()
| time | derry | antrim | down | armagh | fermanagh | tyrone | |
|---|---|---|---|---|---|---|---|
| 0 | 2017-01-02 | NaN | NaN | NaN | NaN | NaN | NaN |
| 1 | 2017-01-09 | NaN | NaN | NaN | NaN | NaN | NaN |
| 2 | 2017-01-16 | NaN | NaN | NaN | NaN | NaN | NaN |
| 3 | 2017-01-23 | NaN | NaN | NaN | NaN | NaN | NaN |
| 4 | 2017-01-30 | NaN | NaN | NaN | NaN | NaN | NaN |
grass_ts.shape
(313, 7)
DATA_DIR = os.path.join(
    "data", "grass_growth", "GrassCheckNI", "grasscheck.csv"
)
# save time series
grass_ts.to_csv(DATA_DIR, index=False)
# set timestamps as the index
grass_ts.set_index("time", inplace=True)
# capitalise county names
counties = []
for c in list(grass_ts):
    counties.append(c.capitalize())
grass_ts.columns = counties
grass_ts.head()
| Derry | Antrim | Down | Armagh | Fermanagh | Tyrone | |
|---|---|---|---|---|---|---|
| time | ||||||
| 2017-01-02 | NaN | NaN | NaN | NaN | NaN | NaN |
| 2017-01-09 | NaN | NaN | NaN | NaN | NaN | NaN |
| 2017-01-16 | NaN | NaN | NaN | NaN | NaN | NaN |
| 2017-01-23 | NaN | NaN | NaN | NaN | NaN | NaN |
| 2017-01-30 | NaN | NaN | NaN | NaN | NaN | NaN |
# pivot table for plotting
grass_piv = grass_ts.copy()
grass_piv["year"] = grass_piv.index.year
grass_piv["weekno"] = grass_piv.index.isocalendar().week
grass_piv = pd.pivot_table(grass_piv, index="weekno", columns="year")
grass_piv.head()
| Antrim | Armagh | ... | Fermanagh | Tyrone | |||||||||||||||||
|---|---|---|---|---|---|---|---|---|---|---|---|---|---|---|---|---|---|---|---|---|---|
| year | 2017 | 2018 | 2019 | 2020 | 2021 | 2022 | 2017 | 2018 | 2019 | 2020 | ... | 2019 | 2020 | 2021 | 2022 | 2017 | 2018 | 2019 | 2020 | 2021 | 2022 |
| weekno | |||||||||||||||||||||
| 12 | NaN | NaN | 13.4 | NaN | 14.6 | 17.6 | NaN | NaN | 16.0 | NaN | ... | 8.9 | NaN | 30.2 | 10.8 | NaN | NaN | 21.0 | NaN | 20.6 | 11.5 |
| 13 | NaN | 15.3 | 23.6 | 8.2 | 22.6 | 36.1 | NaN | 9.4 | 19.1 | 9.9 | ... | 27.1 | 3.7 | 19.4 | 15.7 | NaN | 2.8 | 21.1 | 6.6 | 20.4 | 19.9 |
| 14 | 17.7 | 6.0 | 30.0 | 8.2 | 48.6 | 37.1 | 17.8 | 12.3 | 33.8 | 9.9 | ... | 25.9 | 3.7 | 27.9 | 22.1 | 18.9 | 8.2 | 31.6 | 6.6 | 32.0 | 32.9 |
| 15 | 30.0 | 12.0 | 26.4 | 22.7 | 33.0 | 39.0 | 42.0 | 9.7 | 30.4 | 21.2 | ... | 25.9 | 32.0 | 54.1 | 19.9 | 27.0 | 5.4 | 27.2 | 14.3 | 21.1 | 27.1 |
| 16 | 54.8 | 17.3 | 47.3 | 49.8 | 27.0 | 58.2 | 47.7 | 23.2 | 34.8 | 48.8 | ... | 35.0 | 45.9 | 27.6 | 28.9 | 42.3 | 20.9 | 32.4 | 43.8 | 31.8 | 27.1 |
5 rows × 36 columns
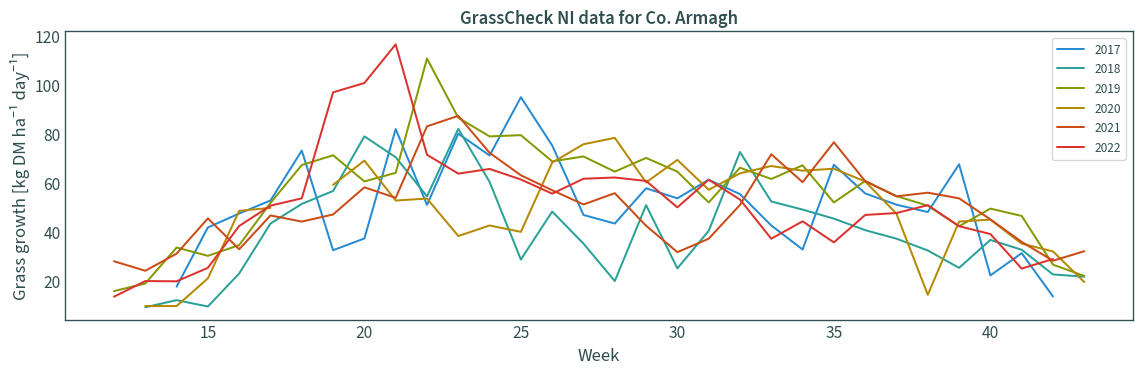
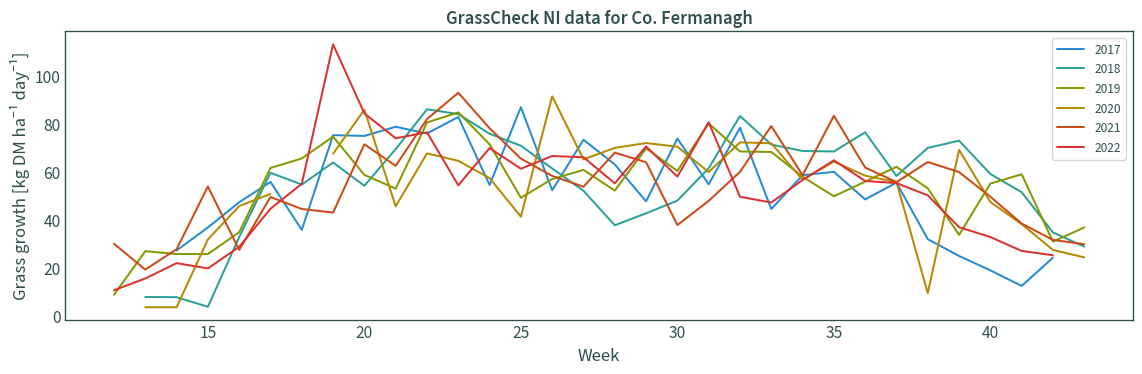
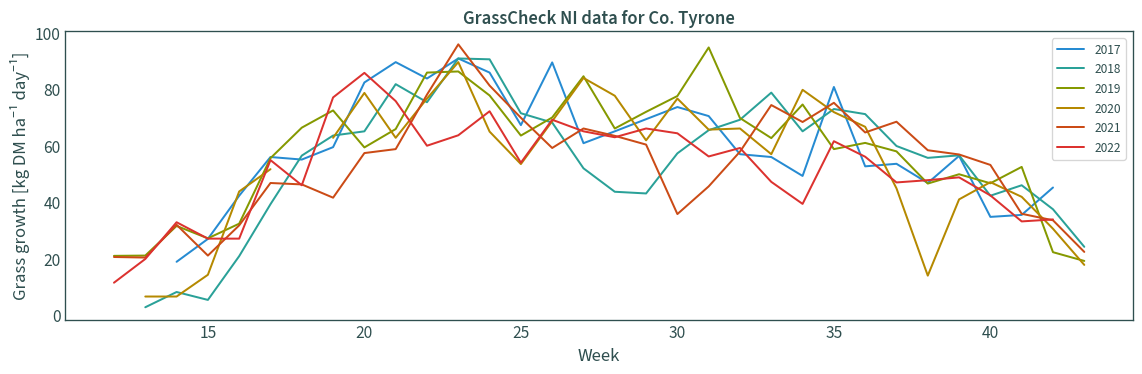
Time series#
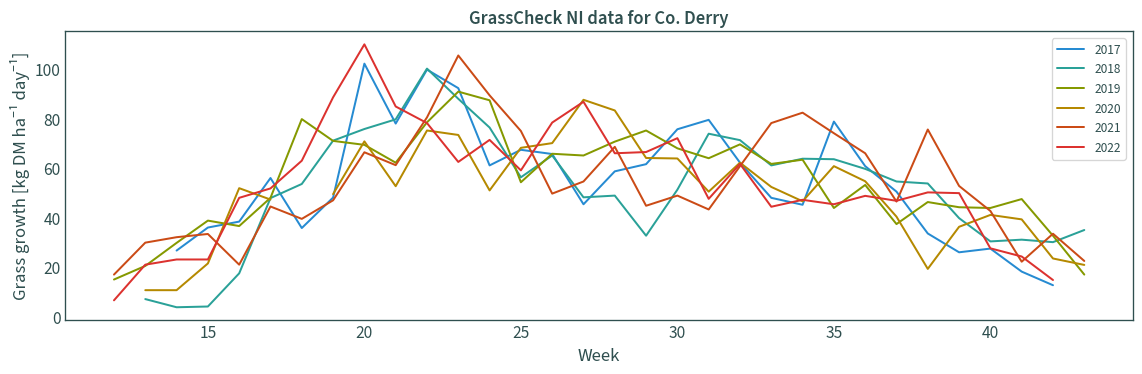
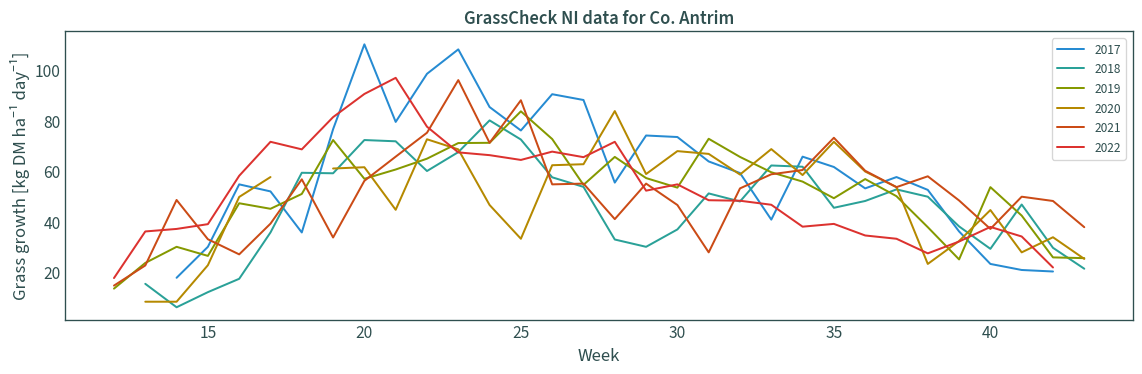
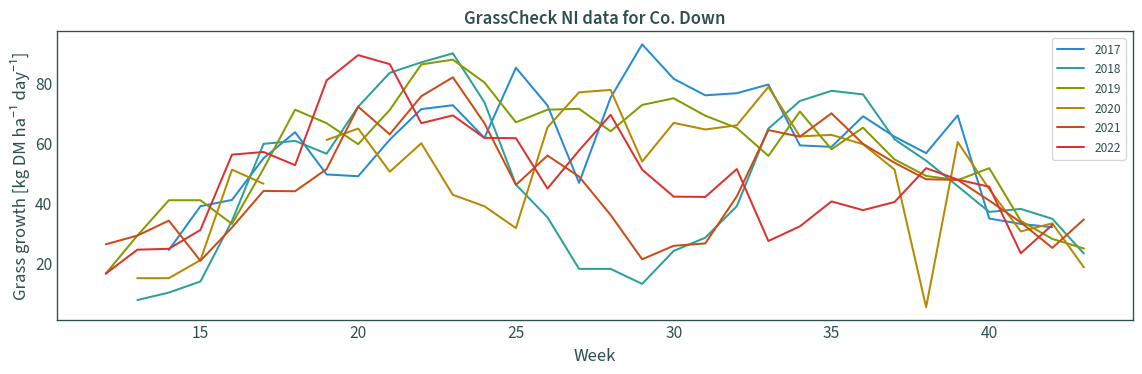
for county in counties:
    grass_piv[county].plot(
        figsize=(12, 4),
        xlabel="Week",
        ylabel="Grass growth [kg DM ha⁻¹ day⁻¹]",
    )
    plt.title(f"GrassCheck NI data for Co. {county}")
    plt.legend(title=None)
    plt.tight_layout()
    plt.show()
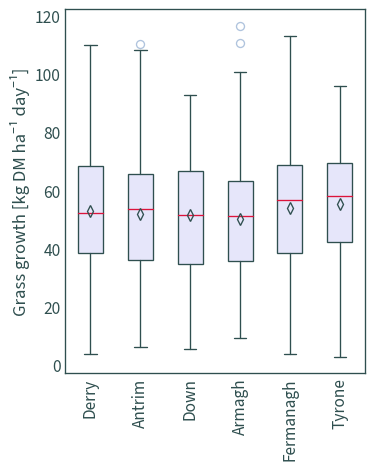
Distribution#
grass_ts.plot.box(
    figsize=(4, 5),
    showmeans=True,
    patch_artist=True,
    color={
        "medians": "Crimson",
        "whiskers": "DarkSlateGrey",
        "caps": "DarkSlateGrey",
    },
    boxprops={"facecolor": "Lavender", "color": "DarkSlateGrey"},
    meanprops={
        "markeredgecolor": "DarkSlateGrey",
        "marker": "d",
        "markerfacecolor": (1, 1, 0, 0),  # transparent
    },
    flierprops={"markeredgecolor": "LightSteelBlue", "zorder": 1},
)
plt.xticks(rotation="vertical")
plt.ylabel("Grass growth [kg DM ha⁻¹ day⁻¹]")
plt.tight_layout()
plt.show()
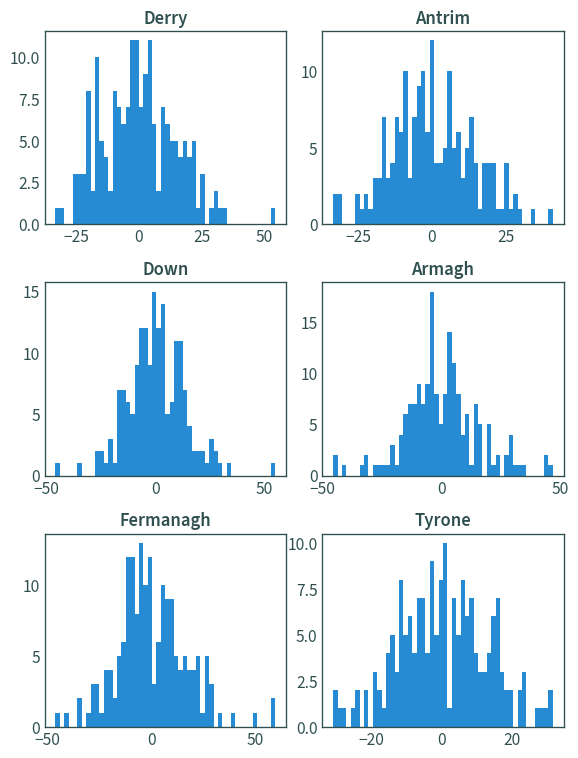
grass_ts.diff().hist(figsize=(6, 8), bins=50, grid=False)
plt.tight_layout()
plt.show()
grass_ts_ = grass_ts.melt(ignore_index=False).rename(
    columns={"variable": "county"}
)
grass_ts_["weekno"] = grass_ts_.index.isocalendar().week
grass_ts_.reset_index(inplace=True)
DATA_DIR = os.path.join(
    "data", "grass_growth", "GrassCheckNI", "grasscheck_cleaned.csv"
)
# save time series
grass_ts_.to_csv(DATA_DIR, index=False)
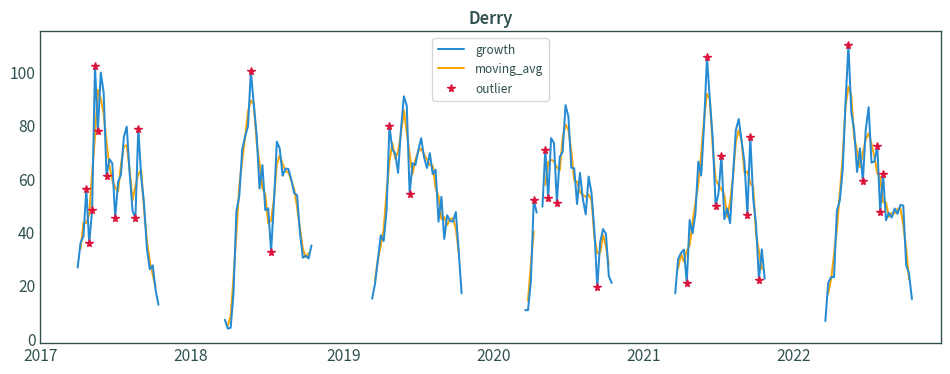
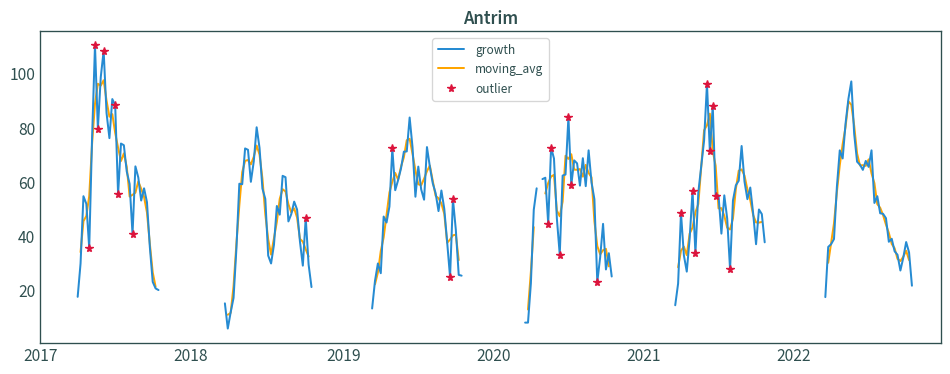
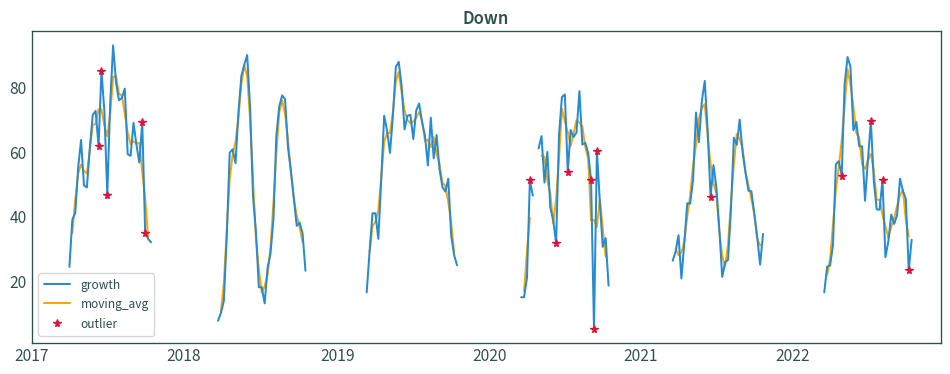
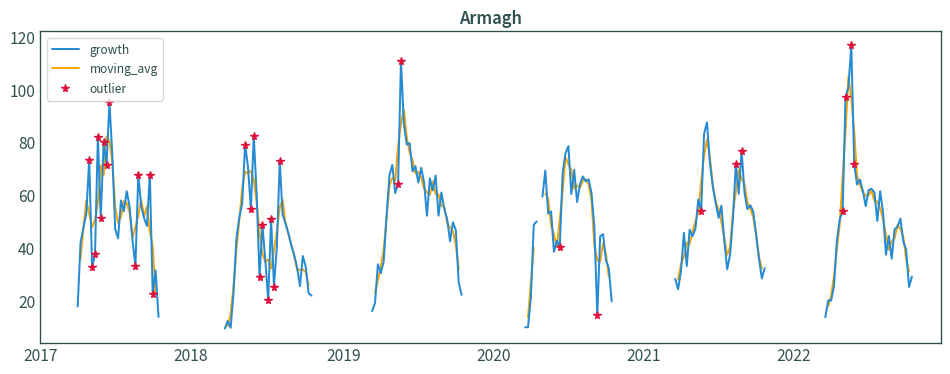
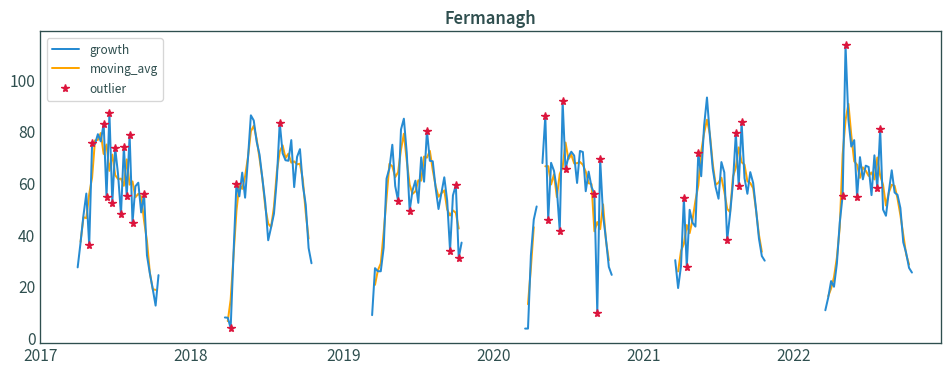
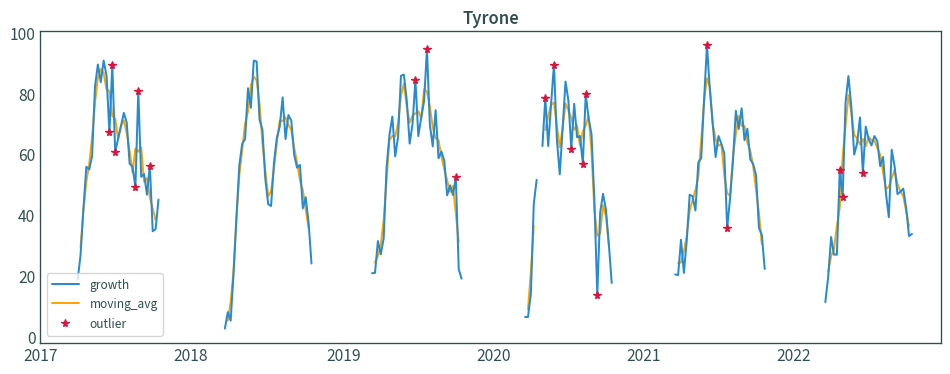
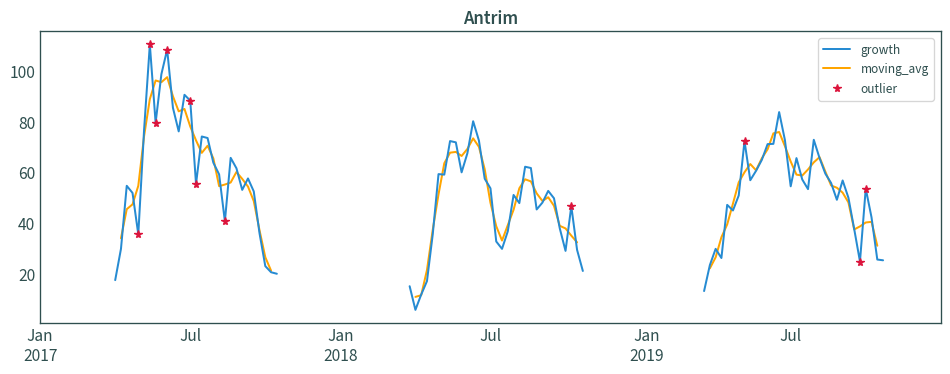
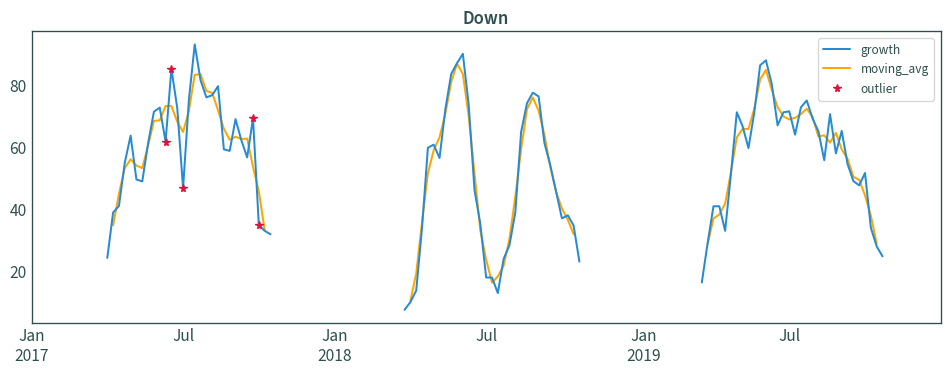
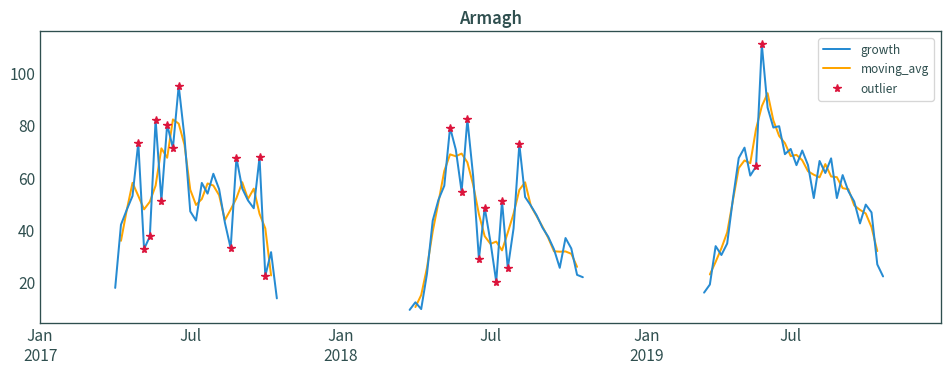
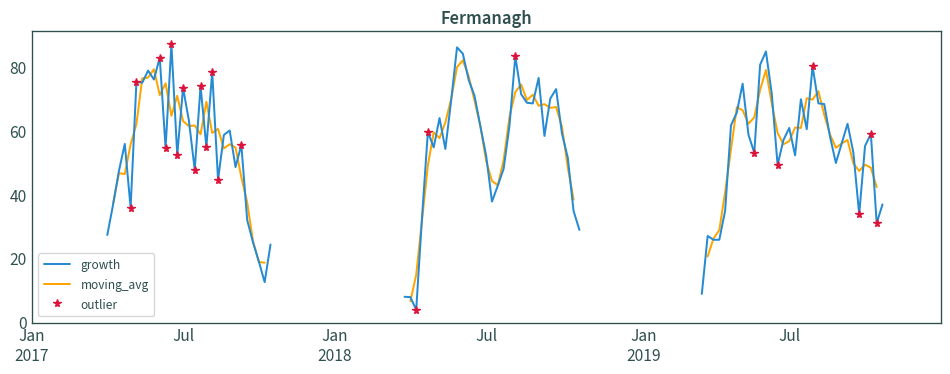
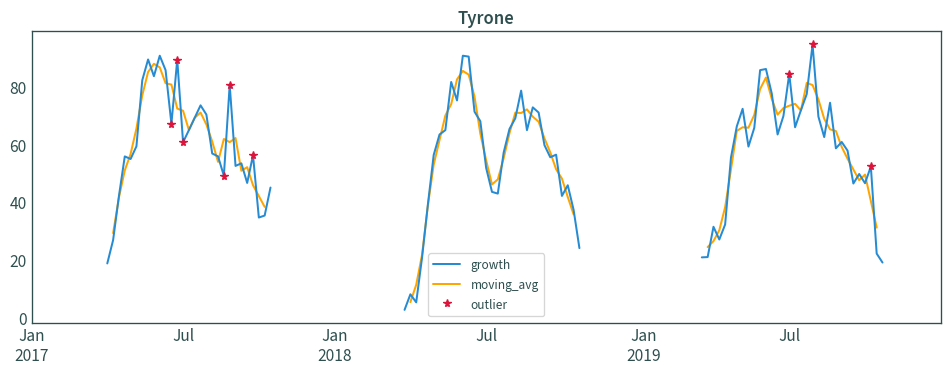
Filtering outliers using 3-week moving average#
grass_out = grass_ts.reset_index()
for county in counties:
    mn = grass_out.rolling(3, center=True, on="time")[county].mean()
    grass_out[f"{county}_outlier"] = grass_out[county].sub(mn).abs().gt(10)
    grass_out[f"{county}_mn"] = mn
grass_out.set_index("time", inplace=True)
for county in counties:
    axs = grass_out.plot(
        # ylim=[0.0, 200.0],
        figsize=(10, 4),
        y=county,
        label="growth",
    )
    grass_out.plot(
        figsize=(10, 4),
        y=f"{county}_mn",
        ax=axs,
        label="moving_avg",
        color="orange",
        zorder=1,
    )
    grass_out[grass_out[f"{county}_outlier"] == True].plot(
        ax=axs,
        linewidth=0.0,
        marker="*",
        y=county,
        label="outlier",
        color="crimson",
    )
    plt.title(county)
    plt.xlabel("")
    plt.tight_layout()
    plt.show()
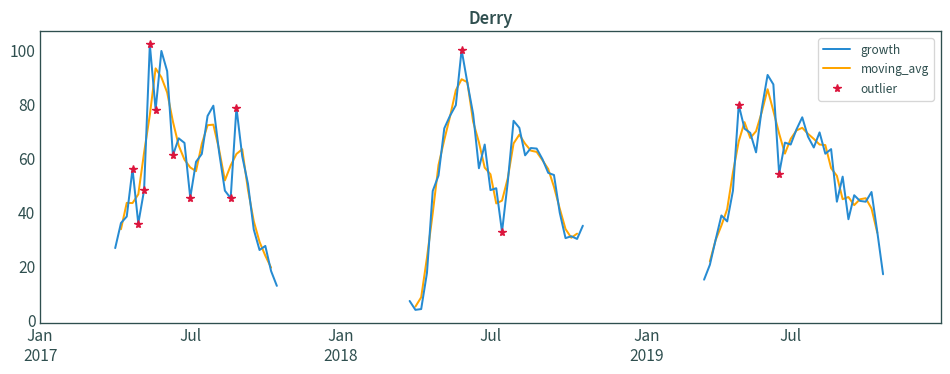
for county in counties:
    axs = grass_out.loc["2017":"2019"].plot(
        # ylim=[0.0, 200.0],
        figsize=(12, 8),
        y=county,
        label="growth",
    )
    grass_out.loc["2017":"2019"].plot(
        figsize=(10, 4),
        y=f"{county}_mn",
        ax=axs,
        label="moving_avg",
        color="orange",
        zorder=1,
    )
    grass_out[grass_out[f"{county}_outlier"] == True].loc["2017":"2019"].plot(
        ax=axs,
        linewidth=0.0,
        marker="*",
        y=county,
        label="outlier",
        color="crimson",
    )
    plt.title(county)
    plt.xlabel("")
    plt.tight_layout()
    plt.show()
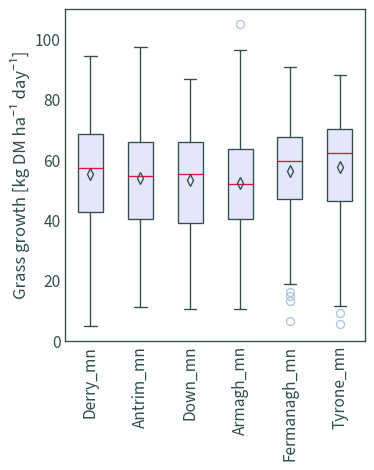
grass_out[[f"{county}_mn" for county in counties]].plot.box(
    figsize=(4, 5),
    showmeans=True,
    patch_artist=True,
    color={
        "medians": "Crimson",
        "whiskers": "DarkSlateGrey",
        "caps": "DarkSlateGrey",
    },
    boxprops={"facecolor": "Lavender", "color": "DarkSlateGrey"},
    meanprops={
        "markeredgecolor": "DarkSlateGrey",
        "marker": "d",
        "markerfacecolor": (1, 1, 0, 0),  # transparent
    },
    flierprops={"markeredgecolor": "LightSteelBlue", "zorder": 1},
)
plt.xticks(rotation="vertical")
plt.ylabel("Grass growth [kg DM ha⁻¹ day⁻¹]")
plt.tight_layout()
plt.show()