ModVege with EURO-CORDEX data#
Jouven, M., Carrère, P., and Baumont, R. (2006a). ‘Model predicting dynamics of biomass, structure and digestibility of herbage in managed permanent pastures. 1. Model description’, Grass and Forage Science, vol. 61, no. 2, pp. 112-124. DOI: 10.1111/j.1365-2494.2006.00515.x.
Jouven, M., Carrère, P., and Baumont, R. (2006b). ‘Model predicting dynamics of biomass, structure and digestibility of herbage in managed permanent pastures. 2. Model evaluation’, Grass and Forage Science, vol. 61, no. 2, pp. 125-133. DOI: 10.1111/j.1365-2494.2006.00517.x.
Agri4cast (2023). ‘ModVege’. Available at: https://code.europa.eu/agri4cast/modvege (Accessed: 28 August 2023).
import glob
import os
from datetime import datetime, timezone
import geopandas as gpd
import matplotlib.pyplot as plt
import numpy as np
import pandas as pd
import xarray as xr
import climag.plot_configs as cplt
from climag import climag_plot
DATA_DIR = os.path.join("data", "ModVege")
# Ireland boundary
GPKG_BOUNDARY = os.path.join("data", "boundaries", "boundaries_all.gpkg")
ie = gpd.read_file(GPKG_BOUNDARY, layer="NUTS_RG_01M_2021_2157_IE")
ie_bbox = gpd.read_file(
    GPKG_BOUNDARY, layer="NUTS_RG_01M_2021_2157_IE_BBOX_DIFF"
)
# met station coords
LON, LAT = -8.26389, 52.16389  # Moorepark, Fermoy
Historical data#
data = xr.open_mfdataset(
    glob.glob(
        os.path.join(DATA_DIR, "EURO-CORDEX", "historical", "EC-EARTH", "*.nc")
    ),
    chunks="auto",
    decode_coords="all",
)
data
<xarray.Dataset>
Dimensions:       (rlat: 33, rlon: 37, time: 11323, bnds: 2)
Coordinates:
    lat           (rlat, rlon) float64 dask.array<chunksize=(33, 37), meta=np.ndarray>
    lon           (rlat, rlon) float64 dask.array<chunksize=(33, 37), meta=np.ndarray>
  * rlat          (rlat) float64 3.685 3.795 3.905 4.015 ... 6.985 7.095 7.205
  * rlon          (rlon) float64 -17.27 -17.16 -17.05 ... -13.53 -13.41 -13.3
  * time          (time) datetime64[ns] 1975-01-01T12:00:00 ... 2005-12-31T12...
    height        float64 2.0
    rotated_pole  |S1 b''
    time_bnds     (time, bnds) datetime64[ns] dask.array<chunksize=(365, 2), meta=np.ndarray>
    spatial_ref   int64 0
Dimensions without coordinates: bnds
Data variables: (12/24)
    bm_gv         (time, rlat, rlon) float32 dask.array<chunksize=(365, 33, 37), meta=np.ndarray>
    bm_gr         (time, rlat, rlon) float32 dask.array<chunksize=(365, 33, 37), meta=np.ndarray>
    bm_dv         (time, rlat, rlon) float32 dask.array<chunksize=(365, 33, 37), meta=np.ndarray>
    bm_dr         (time, rlat, rlon) float32 dask.array<chunksize=(365, 33, 37), meta=np.ndarray>
    age_gv        (time, rlat, rlon) float32 dask.array<chunksize=(365, 33, 37), meta=np.ndarray>
    age_gr        (time, rlat, rlon) float32 dask.array<chunksize=(365, 33, 37), meta=np.ndarray>
    ...            ...
    sen_gv        (time, rlat, rlon) float32 dask.array<chunksize=(365, 33, 37), meta=np.ndarray>
    sen_gr        (time, rlat, rlon) float32 dask.array<chunksize=(365, 33, 37), meta=np.ndarray>
    abs_dv        (time, rlat, rlon) float32 dask.array<chunksize=(365, 33, 37), meta=np.ndarray>
    abs_dr        (time, rlat, rlon) float32 dask.array<chunksize=(365, 33, 37), meta=np.ndarray>
    omd_gv        (time, rlat, rlon) float32 dask.array<chunksize=(365, 33, 37), meta=np.ndarray>
    omd_gr        (time, rlat, rlon) float32 dask.array<chunksize=(365, 33, 37), meta=np.ndarray>
Attributes:
    creation_date:  2023-03-11 00:16:37.316077+00:00
    contact:        nstreethran@ucc.ie
    frequency:      day
    references:     https://github.com/ClimAg
    input_dataset:  IE_EURO-CORDEX_RCA4_EC-EARTH_historical
xarray.Dataset
- rlat: 33
- rlon: 37
- time: 11323
- bnds: 2
- lat(rlat, rlon)float64dask.array<chunksize=(33, 37), meta=np.ndarray>
- standard_name :
- latitude
- long_name :
- latitude
- units :
- degrees_north
Array Chunk Bytes 9.54 kiB 9.54 kiB Shape (33, 37) (33, 37) Dask graph 1 chunks in 150 graph layers Data type float64 numpy.ndarray - lon(rlat, rlon)float64dask.array<chunksize=(33, 37), meta=np.ndarray>
- standard_name :
- longitude
- long_name :
- longitude
- units :
- degrees_east
Array Chunk Bytes 9.54 kiB 9.54 kiB Shape (33, 37) (33, 37) Dask graph 1 chunks in 150 graph layers Data type float64 numpy.ndarray - rlat(rlat)float643.685 3.795 3.905 ... 7.095 7.205
- standard_name :
- latitude
- long_name :
- latitude
- units :
- degrees_north
- axis :
- Y
array([3.685, 3.795, 3.905, 4.015, 4.125, 4.235, 4.345, 4.455, 4.565, 4.675, 4.785, 4.895, 5.005, 5.115, 5.225, 5.335, 5.445, 5.555, 5.665, 5.775, 5.885, 5.995, 6.105, 6.215, 6.325, 6.435, 6.545, 6.655, 6.765, 6.875, 6.985, 7.095, 7.205]) - rlon(rlon)float64-17.27 -17.16 ... -13.41 -13.3
- standard_name :
- longitude
- long_name :
- longitude
- units :
- degrees_east
- axis :
- X
array([-17.265, -17.155, -17.045, -16.935, -16.825, -16.715, -16.605, -16.495, -16.385, -16.275, -16.165, -16.055, -15.945, -15.835, -15.725, -15.615, -15.505, -15.395, -15.285, -15.175, -15.065, -14.955, -14.845, -14.735, -14.625, -14.515, -14.405, -14.295, -14.185, -14.075, -13.965, -13.855, -13.745, -13.635, -13.525, -13.415, -13.305]) - time(time)datetime64[ns]1975-01-01T12:00:00 ... 2005-12-...
- standard_name :
- time
- long_name :
- time
- axis :
- T
array(['1975-01-01T12:00:00.000000000', '1975-01-02T12:00:00.000000000', '1975-01-03T12:00:00.000000000', ..., '2005-12-29T12:00:00.000000000', '2005-12-30T12:00:00.000000000', '2005-12-31T12:00:00.000000000'], dtype='datetime64[ns]') - height()float642.0
- axis :
- Z
- long_name :
- height
- positive :
- up
- standard_name :
- height
- units :
- m
array(2.)
- rotated_pole()|S1b''
- grid_mapping_name :
- rotated_latitude_longitude
- grid_north_pole_latitude :
- 39.25
- grid_north_pole_longitude :
- -162.0
array(b'', dtype='|S1')
- time_bnds(time, bnds)datetime64[ns]dask.array<chunksize=(365, 2), meta=np.ndarray>
Array Chunk Bytes 176.92 kiB 5.72 kiB Shape (11323, 2) (366, 2) Dask graph 31 chunks in 63 graph layers Data type datetime64[ns] numpy.ndarray - spatial_ref()int640
- crs_wkt :
- GEOGCRS["undefined",BASEGEOGCRS["undefined",DATUM["World Geodetic System 1984",ELLIPSOID["WGS 84",6378137,298.257223563,LENGTHUNIT["metre",1]],ID["EPSG",6326]],PRIMEM["Greenwich",0,ANGLEUNIT["degree",0.0174532925199433],ID["EPSG",8901]]],DERIVINGCONVERSION["Pole rotation (netCDF CF convention)",METHOD["Pole rotation (netCDF CF convention)"],PARAMETER["Grid north pole latitude (netCDF CF convention)",39.25,ANGLEUNIT["degree",0.0174532925199433,ID["EPSG",9122]]],PARAMETER["Grid north pole longitude (netCDF CF convention)",-162,ANGLEUNIT["degree",0.0174532925199433,ID["EPSG",9122]]],PARAMETER["North pole grid longitude (netCDF CF convention)",0,ANGLEUNIT["degree",0.0174532925199433,ID["EPSG",9122]]]],CS[ellipsoidal,2],AXIS["longitude",east,ORDER[1],ANGLEUNIT["degree",0.0174532925199433,ID["EPSG",9122]]],AXIS["latitude",north,ORDER[2],ANGLEUNIT["degree",0.0174532925199433,ID["EPSG",9122]]]]
- semi_major_axis :
- 6378137.0
- semi_minor_axis :
- 6356752.314245179
- inverse_flattening :
- 298.257223563
- reference_ellipsoid_name :
- WGS 84
- longitude_of_prime_meridian :
- 0.0
- prime_meridian_name :
- Greenwich
- geographic_crs_name :
- undefined
- grid_mapping_name :
- rotated_latitude_longitude
- grid_north_pole_latitude :
- 39.25
- grid_north_pole_longitude :
- -162.0
- north_pole_grid_longitude :
- 0.0
- horizontal_datum_name :
- World Geodetic System 1984
- spatial_ref :
- GEOGCRS["undefined",BASEGEOGCRS["undefined",DATUM["World Geodetic System 1984",ELLIPSOID["WGS 84",6378137,298.257223563,LENGTHUNIT["metre",1]],ID["EPSG",6326]],PRIMEM["Greenwich",0,ANGLEUNIT["degree",0.0174532925199433],ID["EPSG",8901]]],DERIVINGCONVERSION["Pole rotation (netCDF CF convention)",METHOD["Pole rotation (netCDF CF convention)"],PARAMETER["Grid north pole latitude (netCDF CF convention)",39.25,ANGLEUNIT["degree",0.0174532925199433,ID["EPSG",9122]]],PARAMETER["Grid north pole longitude (netCDF CF convention)",-162,ANGLEUNIT["degree",0.0174532925199433,ID["EPSG",9122]]],PARAMETER["North pole grid longitude (netCDF CF convention)",0,ANGLEUNIT["degree",0.0174532925199433,ID["EPSG",9122]]]],CS[ellipsoidal,2],AXIS["longitude",east,ORDER[1],ANGLEUNIT["degree",0.0174532925199433,ID["EPSG",9122]]],AXIS["latitude",north,ORDER[2],ANGLEUNIT["degree",0.0174532925199433,ID["EPSG",9122]]]]
- GeoTransform :
- -17.32 0.11 0.0 3.629999999999999 0.0 0.11
array(0)
- bm_gv(time, rlat, rlon)float32dask.array<chunksize=(365, 33, 37), meta=np.ndarray>
- long_name :
- Green vegetative biomass
- units :
- kg DM ha⁻¹
Array Chunk Bytes 52.74 MiB 1.70 MiB Shape (11323, 33, 37) (366, 33, 37) Dask graph 31 chunks in 63 graph layers Data type float32 numpy.ndarray - bm_gr(time, rlat, rlon)float32dask.array<chunksize=(365, 33, 37), meta=np.ndarray>
- long_name :
- Green reproductive biomass
- units :
- kg DM ha⁻¹
Array Chunk Bytes 52.74 MiB 1.70 MiB Shape (11323, 33, 37) (366, 33, 37) Dask graph 31 chunks in 63 graph layers Data type float32 numpy.ndarray - bm_dv(time, rlat, rlon)float32dask.array<chunksize=(365, 33, 37), meta=np.ndarray>
- long_name :
- Dead vegetative biomass
- units :
- kg DM ha⁻¹
Array Chunk Bytes 52.74 MiB 1.70 MiB Shape (11323, 33, 37) (366, 33, 37) Dask graph 31 chunks in 63 graph layers Data type float32 numpy.ndarray - bm_dr(time, rlat, rlon)float32dask.array<chunksize=(365, 33, 37), meta=np.ndarray>
- long_name :
- Dead reproductive biomass
- units :
- kg DM ha⁻¹
Array Chunk Bytes 52.74 MiB 1.70 MiB Shape (11323, 33, 37) (366, 33, 37) Dask graph 31 chunks in 63 graph layers Data type float32 numpy.ndarray - age_gv(time, rlat, rlon)float32dask.array<chunksize=(365, 33, 37), meta=np.ndarray>
- long_name :
- Green vegetative biomass age
- units :
- kg DM ha⁻¹
Array Chunk Bytes 52.74 MiB 1.70 MiB Shape (11323, 33, 37) (366, 33, 37) Dask graph 31 chunks in 63 graph layers Data type float32 numpy.ndarray - age_gr(time, rlat, rlon)float32dask.array<chunksize=(365, 33, 37), meta=np.ndarray>
- long_name :
- Green reproductive biomass age
- units :
- kg DM ha⁻¹
Array Chunk Bytes 52.74 MiB 1.70 MiB Shape (11323, 33, 37) (366, 33, 37) Dask graph 31 chunks in 63 graph layers Data type float32 numpy.ndarray - age_dv(time, rlat, rlon)float32dask.array<chunksize=(365, 33, 37), meta=np.ndarray>
- long_name :
- Dead vegetative biomass age
- units :
- kg DM ha⁻¹
Array Chunk Bytes 52.74 MiB 1.70 MiB Shape (11323, 33, 37) (366, 33, 37) Dask graph 31 chunks in 63 graph layers Data type float32 numpy.ndarray - age_dr(time, rlat, rlon)float32dask.array<chunksize=(365, 33, 37), meta=np.ndarray>
- long_name :
- Dead reproductive biomass age
- units :
- kg DM ha⁻¹
Array Chunk Bytes 52.74 MiB 1.70 MiB Shape (11323, 33, 37) (366, 33, 37) Dask graph 31 chunks in 63 graph layers Data type float32 numpy.ndarray - bm(time, rlat, rlon)float32dask.array<chunksize=(365, 33, 37), meta=np.ndarray>
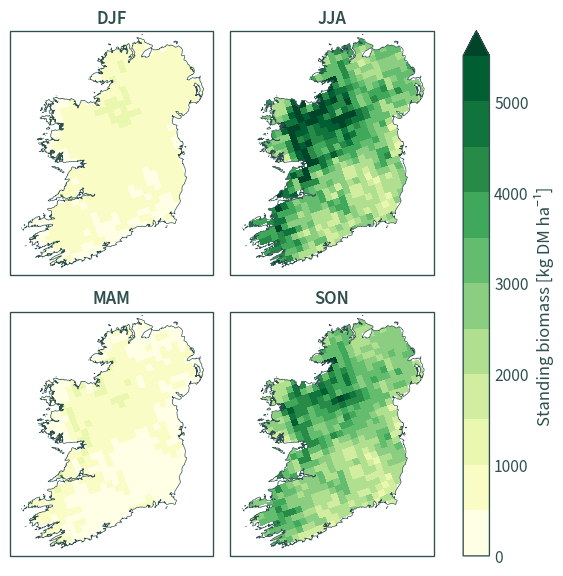
- long_name :
- Standing biomass
- units :
- kg DM ha⁻¹
Array Chunk Bytes 52.74 MiB 1.70 MiB Shape (11323, 33, 37) (366, 33, 37) Dask graph 31 chunks in 63 graph layers Data type float32 numpy.ndarray - pgro(time, rlat, rlon)float32dask.array<chunksize=(365, 33, 37), meta=np.ndarray>
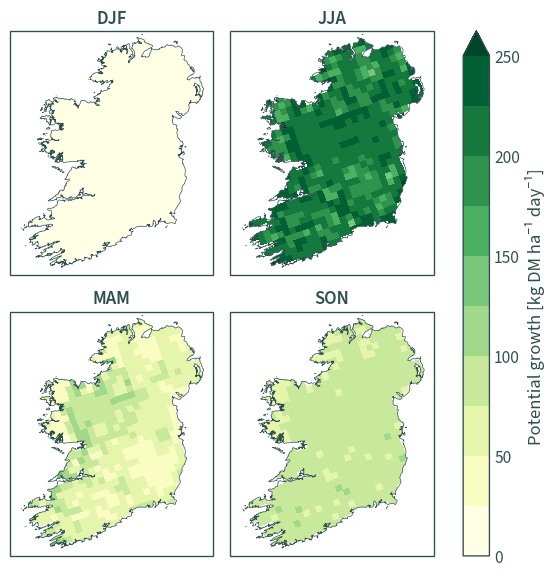
- long_name :
- Potential growth
- units :
- kg DM ha⁻¹ day⁻¹
Array Chunk Bytes 52.74 MiB 1.70 MiB Shape (11323, 33, 37) (366, 33, 37) Dask graph 31 chunks in 63 graph layers Data type float32 numpy.ndarray - gro(time, rlat, rlon)float32dask.array<chunksize=(365, 33, 37), meta=np.ndarray>
- long_name :
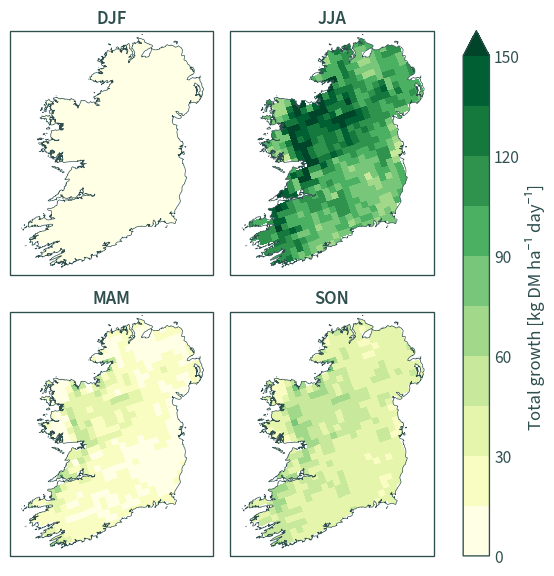
- Total growth
- units :
- kg DM ha⁻¹ day⁻¹
Array Chunk Bytes 52.74 MiB 1.70 MiB Shape (11323, 33, 37) (366, 33, 37) Dask graph 31 chunks in 63 graph layers Data type float32 numpy.ndarray - i_bm(time, rlat, rlon)float32dask.array<chunksize=(365, 33, 37), meta=np.ndarray>
- long_name :
- Ingested biomass
- units :
- kg DM ha⁻¹
Array Chunk Bytes 52.74 MiB 1.70 MiB Shape (11323, 33, 37) (366, 33, 37) Dask graph 31 chunks in 63 graph layers Data type float32 numpy.ndarray - h_bm(time, rlat, rlon)float32dask.array<chunksize=(365, 33, 37), meta=np.ndarray>
- long_name :
- Harvested biomass
- units :
- kg DM ha⁻¹
Array Chunk Bytes 52.74 MiB 1.70 MiB Shape (11323, 33, 37) (366, 33, 37) Dask graph 31 chunks in 63 graph layers Data type float32 numpy.ndarray - c_bm(time, rlat, rlon)float32dask.array<chunksize=(365, 33, 37), meta=np.ndarray>
- long_name :
- Daily ingested biomass
- units :
- kg DM ha⁻¹ day⁻¹
Array Chunk Bytes 52.74 MiB 1.70 MiB Shape (11323, 33, 37) (366, 33, 37) Dask graph 31 chunks in 63 graph layers Data type float32 numpy.ndarray - env(time, rlat, rlon)float32dask.array<chunksize=(365, 33, 37), meta=np.ndarray>
- long_name :
- Environmental limitation of growth
- units :
- dimensionless
Array Chunk Bytes 52.74 MiB 1.70 MiB Shape (11323, 33, 37) (366, 33, 37) Dask graph 31 chunks in 63 graph layers Data type float32 numpy.ndarray - lai(time, rlat, rlon)float32dask.array<chunksize=(365, 33, 37), meta=np.ndarray>
- long_name :
- Leaf area index
- units :
- dimensionless
Array Chunk Bytes 52.74 MiB 1.70 MiB Shape (11323, 33, 37) (366, 33, 37) Dask graph 31 chunks in 63 graph layers Data type float32 numpy.ndarray - aet(time, rlat, rlon)float32dask.array<chunksize=(365, 33, 37), meta=np.ndarray>
- long_name :
- Actual evapotranspiration
- units :
- mm day⁻¹
Array Chunk Bytes 52.74 MiB 1.70 MiB Shape (11323, 33, 37) (366, 33, 37) Dask graph 31 chunks in 63 graph layers Data type float32 numpy.ndarray - wr(time, rlat, rlon)float32dask.array<chunksize=(365, 33, 37), meta=np.ndarray>
- long_name :
- Water reserves
- units :
- mm day⁻¹
Array Chunk Bytes 52.74 MiB 1.70 MiB Shape (11323, 33, 37) (366, 33, 37) Dask graph 31 chunks in 63 graph layers Data type float32 numpy.ndarray - sen_gv(time, rlat, rlon)float32dask.array<chunksize=(365, 33, 37), meta=np.ndarray>
- long_name :
- Senescence of green vegetative biomass
- units :
- kg DM ha⁻¹
Array Chunk Bytes 52.74 MiB 1.70 MiB Shape (11323, 33, 37) (366, 33, 37) Dask graph 31 chunks in 63 graph layers Data type float32 numpy.ndarray - sen_gr(time, rlat, rlon)float32dask.array<chunksize=(365, 33, 37), meta=np.ndarray>
- long_name :
- Senescence of green reproductive biomass
- units :
- kg DM ha⁻¹
Array Chunk Bytes 52.74 MiB 1.70 MiB Shape (11323, 33, 37) (366, 33, 37) Dask graph 31 chunks in 63 graph layers Data type float32 numpy.ndarray - abs_dv(time, rlat, rlon)float32dask.array<chunksize=(365, 33, 37), meta=np.ndarray>
- long_name :
- Abscission of dead vegetative biomass
- units :
- kg DM ha⁻¹
Array Chunk Bytes 52.74 MiB 1.70 MiB Shape (11323, 33, 37) (366, 33, 37) Dask graph 31 chunks in 63 graph layers Data type float32 numpy.ndarray - abs_dr(time, rlat, rlon)float32dask.array<chunksize=(365, 33, 37), meta=np.ndarray>
- long_name :
- Abscission of dead reproductive biomass
- units :
- kg DM ha⁻¹
Array Chunk Bytes 52.74 MiB 1.70 MiB Shape (11323, 33, 37) (366, 33, 37) Dask graph 31 chunks in 63 graph layers Data type float32 numpy.ndarray - omd_gv(time, rlat, rlon)float32dask.array<chunksize=(365, 33, 37), meta=np.ndarray>
- long_name :
- Green vegetative biomass organic matter digestibility
- units :
- kg DM ha⁻¹
Array Chunk Bytes 52.74 MiB 1.70 MiB Shape (11323, 33, 37) (366, 33, 37) Dask graph 31 chunks in 63 graph layers Data type float32 numpy.ndarray - omd_gr(time, rlat, rlon)float32dask.array<chunksize=(365, 33, 37), meta=np.ndarray>
- long_name :
- Green reproductive biomass organic matter digestibility
- units :
- kg DM ha⁻¹
Array Chunk Bytes 52.74 MiB 1.70 MiB Shape (11323, 33, 37) (366, 33, 37) Dask graph 31 chunks in 63 graph layers Data type float32 numpy.ndarray
- rlatPandasIndex
PandasIndex(Float64Index([3.6849999999999987, 3.7950000000000017, 3.905000000000001, 4.015000000000001, 4.125, 4.234999999999999, 4.344999999999999, 4.455000000000002, 4.565000000000001, 4.675000000000001, 4.785, 4.895, 5.004999999999999, 5.114999999999998, 5.225000000000001, 5.335000000000001, 5.445, 5.555, 5.664999999999999, 5.774999999999999, 5.885000000000002, 5.995000000000001, 6.105, 6.215, 6.324999999999999, 6.434999999999999, 6.545000000000002, 6.655000000000001, 6.765000000000001, 6.875, 6.984999999999999, 7.094999999999999, 7.205000000000002], dtype='float64', name='rlat')) - rlonPandasIndex
PandasIndex(Float64Index([ -17.265, -17.155, -17.045, -16.935000000000002, -16.825, -16.715, -16.605, -16.494999999999997, -16.384999999999998, -16.275, -16.165, -16.055, -15.945, -15.834999999999999, -15.725, -15.615, -15.505, -15.395, -15.285, -15.175, -15.065, -14.955, -14.845, -14.735, -14.625, -14.515, -14.405, -14.295, -14.185, -14.075, -13.965, -13.855, -13.745, -13.635, -13.525, -13.415, -13.305], dtype='float64', name='rlon')) - timePandasIndex
PandasIndex(DatetimeIndex(['1975-01-01 12:00:00', '1975-01-02 12:00:00',
               '1975-01-03 12:00:00', '1975-01-04 12:00:00',
               '1975-01-05 12:00:00', '1975-01-06 12:00:00',
               '1975-01-07 12:00:00', '1975-01-08 12:00:00',
               '1975-01-09 12:00:00', '1975-01-10 12:00:00',
               ...
               '2005-12-22 12:00:00', '2005-12-23 12:00:00',
               '2005-12-24 12:00:00', '2005-12-25 12:00:00',
               '2005-12-26 12:00:00', '2005-12-27 12:00:00',
               '2005-12-28 12:00:00', '2005-12-29 12:00:00',
               '2005-12-30 12:00:00', '2005-12-31 12:00:00'],
              dtype='datetime64[ns]', name='time', length=11323, freq=None))
- creation_date :
- 2023-03-11 00:16:37.316077+00:00
- contact :
- nstreethran@ucc.ie
- frequency :
- day
- references :
- https://github.com/ClimAg
- input_dataset :
- IE_EURO-CORDEX_RCA4_EC-EARTH_historical
# remove the spin-up year
data = data.sel(time=slice("1976", "2005"))
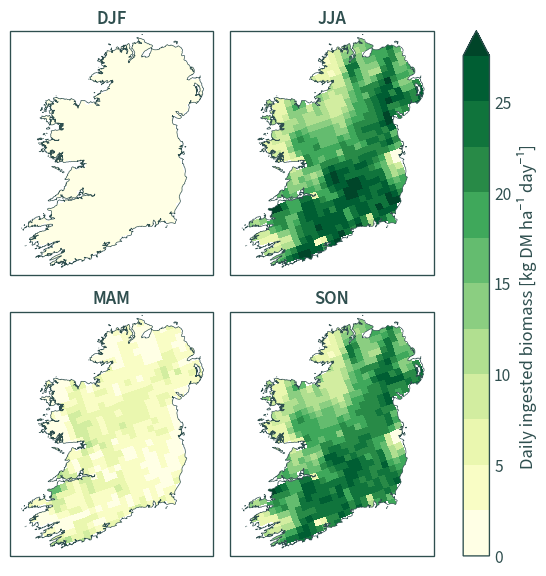
Seasonal averages#
for var in ["gro", "pgro", "bm", "c_bm"]:
    climag_plot.plot_averages(
        data=data,
        var=var,
        averages="season",
        boundary_data=ie_bbox,
        cbar_levels=12,
    )
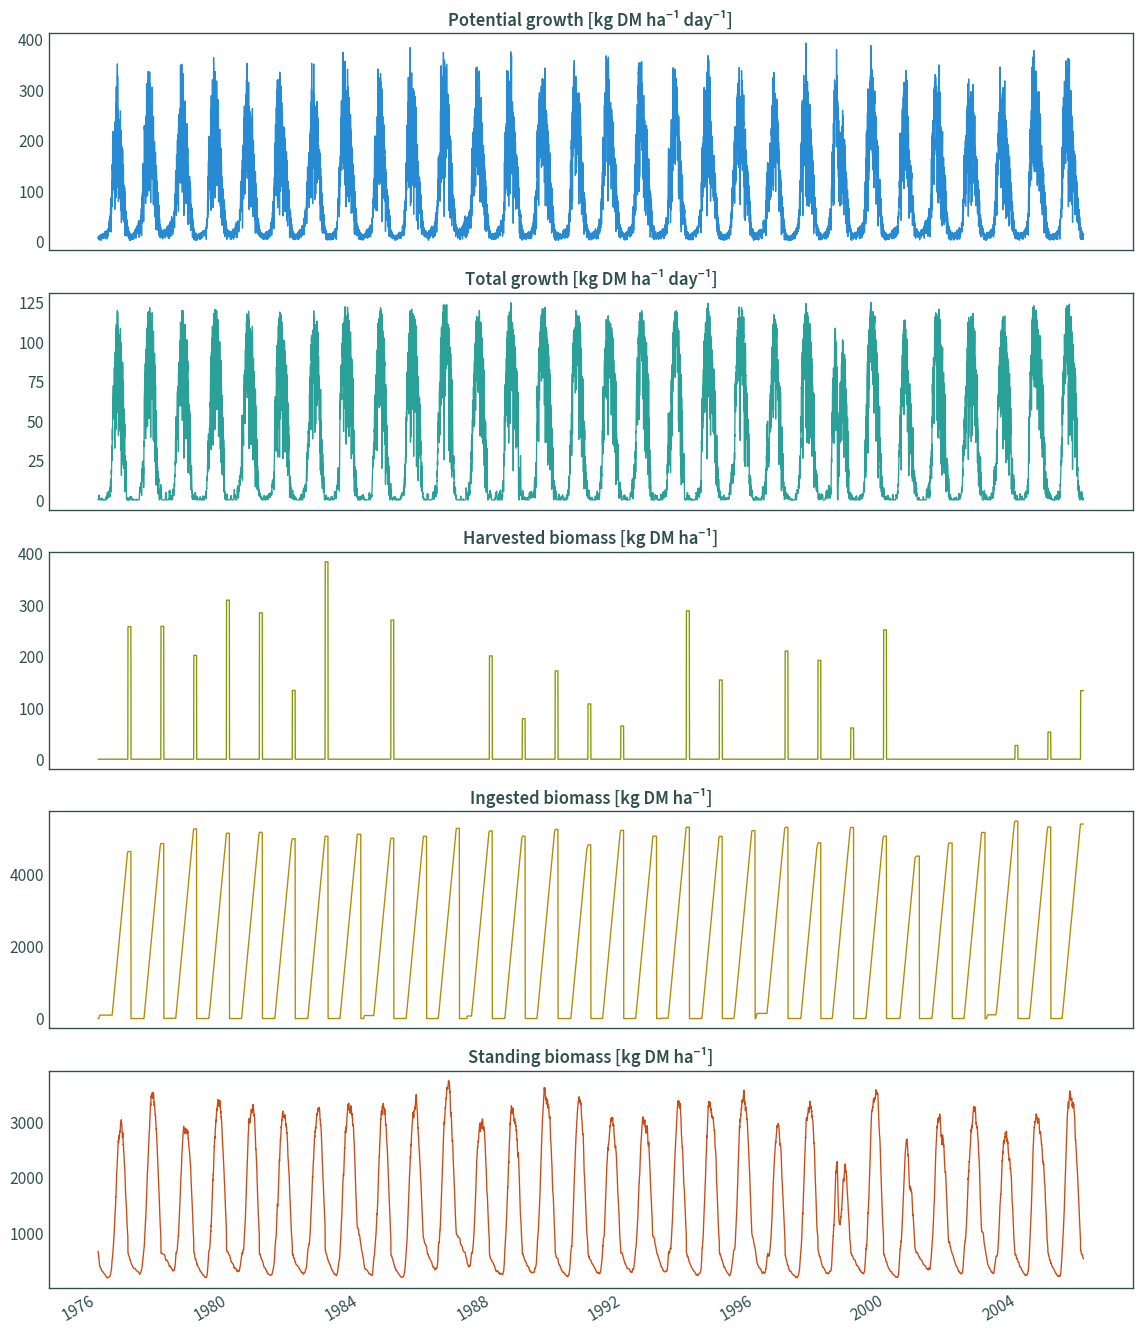
Point subset#
cds = cplt.rotated_pole_point(data=data, lon=LON, lat=LAT)
data_ie = data.sel({"rlon": cds[0], "rlat": cds[1]}, method="nearest")
data_ie
<xarray.Dataset>
Dimensions:       (time: 11323, bnds: 2)
Coordinates:
    lat           float64 dask.array<chunksize=(), meta=np.ndarray>
    lon           float64 dask.array<chunksize=(), meta=np.ndarray>
    rlat          float64 4.235
    rlon          float64 -15.83
  * time          (time) datetime64[ns] 1975-01-01T12:00:00 ... 2005-12-31T12...
    height        float64 2.0
    rotated_pole  |S1 b''
    time_bnds     (time, bnds) datetime64[ns] dask.array<chunksize=(365, 2), meta=np.ndarray>
    spatial_ref   int64 0
Dimensions without coordinates: bnds
Data variables: (12/24)
    bm_gv         (time) float32 dask.array<chunksize=(365,), meta=np.ndarray>
    bm_gr         (time) float32 dask.array<chunksize=(365,), meta=np.ndarray>
    bm_dv         (time) float32 dask.array<chunksize=(365,), meta=np.ndarray>
    bm_dr         (time) float32 dask.array<chunksize=(365,), meta=np.ndarray>
    age_gv        (time) float32 dask.array<chunksize=(365,), meta=np.ndarray>
    age_gr        (time) float32 dask.array<chunksize=(365,), meta=np.ndarray>
    ...            ...
    sen_gv        (time) float32 dask.array<chunksize=(365,), meta=np.ndarray>
    sen_gr        (time) float32 dask.array<chunksize=(365,), meta=np.ndarray>
    abs_dv        (time) float32 dask.array<chunksize=(365,), meta=np.ndarray>
    abs_dr        (time) float32 dask.array<chunksize=(365,), meta=np.ndarray>
    omd_gv        (time) float32 dask.array<chunksize=(365,), meta=np.ndarray>
    omd_gr        (time) float32 dask.array<chunksize=(365,), meta=np.ndarray>
Attributes:
    creation_date:  2023-03-11 00:16:37.316077+00:00
    contact:        nstreethran@ucc.ie
    frequency:      day
    references:     https://github.com/ClimAg
    input_dataset:  IE_EURO-CORDEX_RCA4_EC-EARTH_historical
xarray.Dataset
- time: 11323
- bnds: 2
- lat()float64dask.array<chunksize=(), meta=np.ndarray>
- standard_name :
- latitude
- long_name :
- latitude
- units :
- degrees_north
Array Chunk Bytes 8 B 8 B Shape () () Dask graph 1 chunks in 151 graph layers Data type float64 numpy.ndarray - lon()float64dask.array<chunksize=(), meta=np.ndarray>
- standard_name :
- longitude
- long_name :
- longitude
- units :
- degrees_east
Array Chunk Bytes 8 B 8 B Shape () () Dask graph 1 chunks in 151 graph layers Data type float64 numpy.ndarray - rlat()float644.235
- standard_name :
- latitude
- long_name :
- latitude
- units :
- degrees_north
- axis :
- Y
array(4.235)
- rlon()float64-15.83
- standard_name :
- longitude
- long_name :
- longitude
- units :
- degrees_east
- axis :
- X
array(-15.835)
- time(time)datetime64[ns]1975-01-01T12:00:00 ... 2005-12-...
- standard_name :
- time
- long_name :
- time
- axis :
- T
array(['1975-01-01T12:00:00.000000000', '1975-01-02T12:00:00.000000000', '1975-01-03T12:00:00.000000000', ..., '2005-12-29T12:00:00.000000000', '2005-12-30T12:00:00.000000000', '2005-12-31T12:00:00.000000000'], dtype='datetime64[ns]') - height()float642.0
- axis :
- Z
- long_name :
- height
- positive :
- up
- standard_name :
- height
- units :
- m
array(2.)
- rotated_pole()|S1b''
- grid_mapping_name :
- rotated_latitude_longitude
- grid_north_pole_latitude :
- 39.25
- grid_north_pole_longitude :
- -162.0
array(b'', dtype='|S1')
- time_bnds(time, bnds)datetime64[ns]dask.array<chunksize=(365, 2), meta=np.ndarray>
Array Chunk Bytes 176.92 kiB 5.72 kiB Shape (11323, 2) (366, 2) Dask graph 31 chunks in 63 graph layers Data type datetime64[ns] numpy.ndarray - spatial_ref()int640
- crs_wkt :
- GEOGCRS["undefined",BASEGEOGCRS["undefined",DATUM["World Geodetic System 1984",ELLIPSOID["WGS 84",6378137,298.257223563,LENGTHUNIT["metre",1]],ID["EPSG",6326]],PRIMEM["Greenwich",0,ANGLEUNIT["degree",0.0174532925199433],ID["EPSG",8901]]],DERIVINGCONVERSION["Pole rotation (netCDF CF convention)",METHOD["Pole rotation (netCDF CF convention)"],PARAMETER["Grid north pole latitude (netCDF CF convention)",39.25,ANGLEUNIT["degree",0.0174532925199433,ID["EPSG",9122]]],PARAMETER["Grid north pole longitude (netCDF CF convention)",-162,ANGLEUNIT["degree",0.0174532925199433,ID["EPSG",9122]]],PARAMETER["North pole grid longitude (netCDF CF convention)",0,ANGLEUNIT["degree",0.0174532925199433,ID["EPSG",9122]]]],CS[ellipsoidal,2],AXIS["longitude",east,ORDER[1],ANGLEUNIT["degree",0.0174532925199433,ID["EPSG",9122]]],AXIS["latitude",north,ORDER[2],ANGLEUNIT["degree",0.0174532925199433,ID["EPSG",9122]]]]
- semi_major_axis :
- 6378137.0
- semi_minor_axis :
- 6356752.314245179
- inverse_flattening :
- 298.257223563
- reference_ellipsoid_name :
- WGS 84
- longitude_of_prime_meridian :
- 0.0
- prime_meridian_name :
- Greenwich
- geographic_crs_name :
- undefined
- grid_mapping_name :
- rotated_latitude_longitude
- grid_north_pole_latitude :
- 39.25
- grid_north_pole_longitude :
- -162.0
- north_pole_grid_longitude :
- 0.0
- horizontal_datum_name :
- World Geodetic System 1984
- spatial_ref :
- GEOGCRS["undefined",BASEGEOGCRS["undefined",DATUM["World Geodetic System 1984",ELLIPSOID["WGS 84",6378137,298.257223563,LENGTHUNIT["metre",1]],ID["EPSG",6326]],PRIMEM["Greenwich",0,ANGLEUNIT["degree",0.0174532925199433],ID["EPSG",8901]]],DERIVINGCONVERSION["Pole rotation (netCDF CF convention)",METHOD["Pole rotation (netCDF CF convention)"],PARAMETER["Grid north pole latitude (netCDF CF convention)",39.25,ANGLEUNIT["degree",0.0174532925199433,ID["EPSG",9122]]],PARAMETER["Grid north pole longitude (netCDF CF convention)",-162,ANGLEUNIT["degree",0.0174532925199433,ID["EPSG",9122]]],PARAMETER["North pole grid longitude (netCDF CF convention)",0,ANGLEUNIT["degree",0.0174532925199433,ID["EPSG",9122]]]],CS[ellipsoidal,2],AXIS["longitude",east,ORDER[1],ANGLEUNIT["degree",0.0174532925199433,ID["EPSG",9122]]],AXIS["latitude",north,ORDER[2],ANGLEUNIT["degree",0.0174532925199433,ID["EPSG",9122]]]]
- GeoTransform :
- -17.32 0.11 0.0 3.629999999999999 0.0 0.11
array(0)
- bm_gv(time)float32dask.array<chunksize=(365,), meta=np.ndarray>
- long_name :
- Green vegetative biomass
- units :
- kg DM ha⁻¹
Array Chunk Bytes 44.23 kiB 1.43 kiB Shape (11323,) (366,) Dask graph 31 chunks in 64 graph layers Data type float32 numpy.ndarray - bm_gr(time)float32dask.array<chunksize=(365,), meta=np.ndarray>
- long_name :
- Green reproductive biomass
- units :
- kg DM ha⁻¹
Array Chunk Bytes 44.23 kiB 1.43 kiB Shape (11323,) (366,) Dask graph 31 chunks in 64 graph layers Data type float32 numpy.ndarray - bm_dv(time)float32dask.array<chunksize=(365,), meta=np.ndarray>
- long_name :
- Dead vegetative biomass
- units :
- kg DM ha⁻¹
Array Chunk Bytes 44.23 kiB 1.43 kiB Shape (11323,) (366,) Dask graph 31 chunks in 64 graph layers Data type float32 numpy.ndarray - bm_dr(time)float32dask.array<chunksize=(365,), meta=np.ndarray>
- long_name :
- Dead reproductive biomass
- units :
- kg DM ha⁻¹
Array Chunk Bytes 44.23 kiB 1.43 kiB Shape (11323,) (366,) Dask graph 31 chunks in 64 graph layers Data type float32 numpy.ndarray - age_gv(time)float32dask.array<chunksize=(365,), meta=np.ndarray>
- long_name :
- Green vegetative biomass age
- units :
- kg DM ha⁻¹
Array Chunk Bytes 44.23 kiB 1.43 kiB Shape (11323,) (366,) Dask graph 31 chunks in 64 graph layers Data type float32 numpy.ndarray - age_gr(time)float32dask.array<chunksize=(365,), meta=np.ndarray>
- long_name :
- Green reproductive biomass age
- units :
- kg DM ha⁻¹
Array Chunk Bytes 44.23 kiB 1.43 kiB Shape (11323,) (366,) Dask graph 31 chunks in 64 graph layers Data type float32 numpy.ndarray - age_dv(time)float32dask.array<chunksize=(365,), meta=np.ndarray>
- long_name :
- Dead vegetative biomass age
- units :
- kg DM ha⁻¹
Array Chunk Bytes 44.23 kiB 1.43 kiB Shape (11323,) (366,) Dask graph 31 chunks in 64 graph layers Data type float32 numpy.ndarray - age_dr(time)float32dask.array<chunksize=(365,), meta=np.ndarray>
- long_name :
- Dead reproductive biomass age
- units :
- kg DM ha⁻¹
Array Chunk Bytes 44.23 kiB 1.43 kiB Shape (11323,) (366,) Dask graph 31 chunks in 64 graph layers Data type float32 numpy.ndarray - bm(time)float32dask.array<chunksize=(365,), meta=np.ndarray>
- long_name :
- Standing biomass
- units :
- kg DM ha⁻¹
Array Chunk Bytes 44.23 kiB 1.43 kiB Shape (11323,) (366,) Dask graph 31 chunks in 64 graph layers Data type float32 numpy.ndarray - pgro(time)float32dask.array<chunksize=(365,), meta=np.ndarray>
- long_name :
- Potential growth
- units :
- kg DM ha⁻¹ day⁻¹
Array Chunk Bytes 44.23 kiB 1.43 kiB Shape (11323,) (366,) Dask graph 31 chunks in 64 graph layers Data type float32 numpy.ndarray - gro(time)float32dask.array<chunksize=(365,), meta=np.ndarray>
- long_name :
- Total growth
- units :
- kg DM ha⁻¹ day⁻¹
Array Chunk Bytes 44.23 kiB 1.43 kiB Shape (11323,) (366,) Dask graph 31 chunks in 64 graph layers Data type float32 numpy.ndarray - i_bm(time)float32dask.array<chunksize=(365,), meta=np.ndarray>
- long_name :
- Ingested biomass
- units :
- kg DM ha⁻¹
Array Chunk Bytes 44.23 kiB 1.43 kiB Shape (11323,) (366,) Dask graph 31 chunks in 64 graph layers Data type float32 numpy.ndarray - h_bm(time)float32dask.array<chunksize=(365,), meta=np.ndarray>
- long_name :
- Harvested biomass
- units :
- kg DM ha⁻¹
Array Chunk Bytes 44.23 kiB 1.43 kiB Shape (11323,) (366,) Dask graph 31 chunks in 64 graph layers Data type float32 numpy.ndarray - c_bm(time)float32dask.array<chunksize=(365,), meta=np.ndarray>
- long_name :
- Daily ingested biomass
- units :
- kg DM ha⁻¹ day⁻¹
Array Chunk Bytes 44.23 kiB 1.43 kiB Shape (11323,) (366,) Dask graph 31 chunks in 64 graph layers Data type float32 numpy.ndarray - env(time)float32dask.array<chunksize=(365,), meta=np.ndarray>
- long_name :
- Environmental limitation of growth
- units :
- dimensionless
Array Chunk Bytes 44.23 kiB 1.43 kiB Shape (11323,) (366,) Dask graph 31 chunks in 64 graph layers Data type float32 numpy.ndarray - lai(time)float32dask.array<chunksize=(365,), meta=np.ndarray>
- long_name :
- Leaf area index
- units :
- dimensionless
Array Chunk Bytes 44.23 kiB 1.43 kiB Shape (11323,) (366,) Dask graph 31 chunks in 64 graph layers Data type float32 numpy.ndarray - aet(time)float32dask.array<chunksize=(365,), meta=np.ndarray>
- long_name :
- Actual evapotranspiration
- units :
- mm day⁻¹
Array Chunk Bytes 44.23 kiB 1.43 kiB Shape (11323,) (366,) Dask graph 31 chunks in 64 graph layers Data type float32 numpy.ndarray - wr(time)float32dask.array<chunksize=(365,), meta=np.ndarray>
- long_name :
- Water reserves
- units :
- mm day⁻¹
Array Chunk Bytes 44.23 kiB 1.43 kiB Shape (11323,) (366,) Dask graph 31 chunks in 64 graph layers Data type float32 numpy.ndarray - sen_gv(time)float32dask.array<chunksize=(365,), meta=np.ndarray>
- long_name :
- Senescence of green vegetative biomass
- units :
- kg DM ha⁻¹
Array Chunk Bytes 44.23 kiB 1.43 kiB Shape (11323,) (366,) Dask graph 31 chunks in 64 graph layers Data type float32 numpy.ndarray - sen_gr(time)float32dask.array<chunksize=(365,), meta=np.ndarray>
- long_name :
- Senescence of green reproductive biomass
- units :
- kg DM ha⁻¹
Array Chunk Bytes 44.23 kiB 1.43 kiB Shape (11323,) (366,) Dask graph 31 chunks in 64 graph layers Data type float32 numpy.ndarray - abs_dv(time)float32dask.array<chunksize=(365,), meta=np.ndarray>
- long_name :
- Abscission of dead vegetative biomass
- units :
- kg DM ha⁻¹
Array Chunk Bytes 44.23 kiB 1.43 kiB Shape (11323,) (366,) Dask graph 31 chunks in 64 graph layers Data type float32 numpy.ndarray - abs_dr(time)float32dask.array<chunksize=(365,), meta=np.ndarray>
- long_name :
- Abscission of dead reproductive biomass
- units :
- kg DM ha⁻¹
Array Chunk Bytes 44.23 kiB 1.43 kiB Shape (11323,) (366,) Dask graph 31 chunks in 64 graph layers Data type float32 numpy.ndarray - omd_gv(time)float32dask.array<chunksize=(365,), meta=np.ndarray>
- long_name :
- Green vegetative biomass organic matter digestibility
- units :
- kg DM ha⁻¹
Array Chunk Bytes 44.23 kiB 1.43 kiB Shape (11323,) (366,) Dask graph 31 chunks in 64 graph layers Data type float32 numpy.ndarray - omd_gr(time)float32dask.array<chunksize=(365,), meta=np.ndarray>
- long_name :
- Green reproductive biomass organic matter digestibility
- units :
- kg DM ha⁻¹
Array Chunk Bytes 44.23 kiB 1.43 kiB Shape (11323,) (366,) Dask graph 31 chunks in 64 graph layers Data type float32 numpy.ndarray
- timePandasIndex
PandasIndex(DatetimeIndex(['1975-01-01 12:00:00', '1975-01-02 12:00:00',
               '1975-01-03 12:00:00', '1975-01-04 12:00:00',
               '1975-01-05 12:00:00', '1975-01-06 12:00:00',
               '1975-01-07 12:00:00', '1975-01-08 12:00:00',
               '1975-01-09 12:00:00', '1975-01-10 12:00:00',
               ...
               '2005-12-22 12:00:00', '2005-12-23 12:00:00',
               '2005-12-24 12:00:00', '2005-12-25 12:00:00',
               '2005-12-26 12:00:00', '2005-12-27 12:00:00',
               '2005-12-28 12:00:00', '2005-12-29 12:00:00',
               '2005-12-30 12:00:00', '2005-12-31 12:00:00'],
              dtype='datetime64[ns]', name='time', length=11323, freq=None))
- creation_date :
- 2023-03-11 00:16:37.316077+00:00
- contact :
- nstreethran@ucc.ie
- frequency :
- day
- references :
- https://github.com/ClimAg
- input_dataset :
- IE_EURO-CORDEX_RCA4_EC-EARTH_historical
data_ie = data.sel({"rlon": cds[0], "rlat": cds[1]}, method="nearest")

data_ie_df = pd.DataFrame({"time": data_ie["time"]})
for var in data_ie.data_vars:
    data_ie_df[var] = data_ie[var]

data_ie_df.set_index("time", inplace=True)
data_ie_df = data_ie_df[["pgro", "gro", "h_bm", "i_bm", "bm"]]

# configure plot title
plot_title = []
for var in list(data_ie_df):
    plot_title.append(
        f"{data_ie[var].attrs['long_name']} [{data_ie[var].attrs['units']}]"
    )

data_ie_df.plot(
    subplots=True,
    layout=(5, 1),
    figsize=(12, 14),
    legend=False,
    xlabel="",
    title=plot_title,
    linewidth=1,
)

plt.tight_layout()
plt.show()
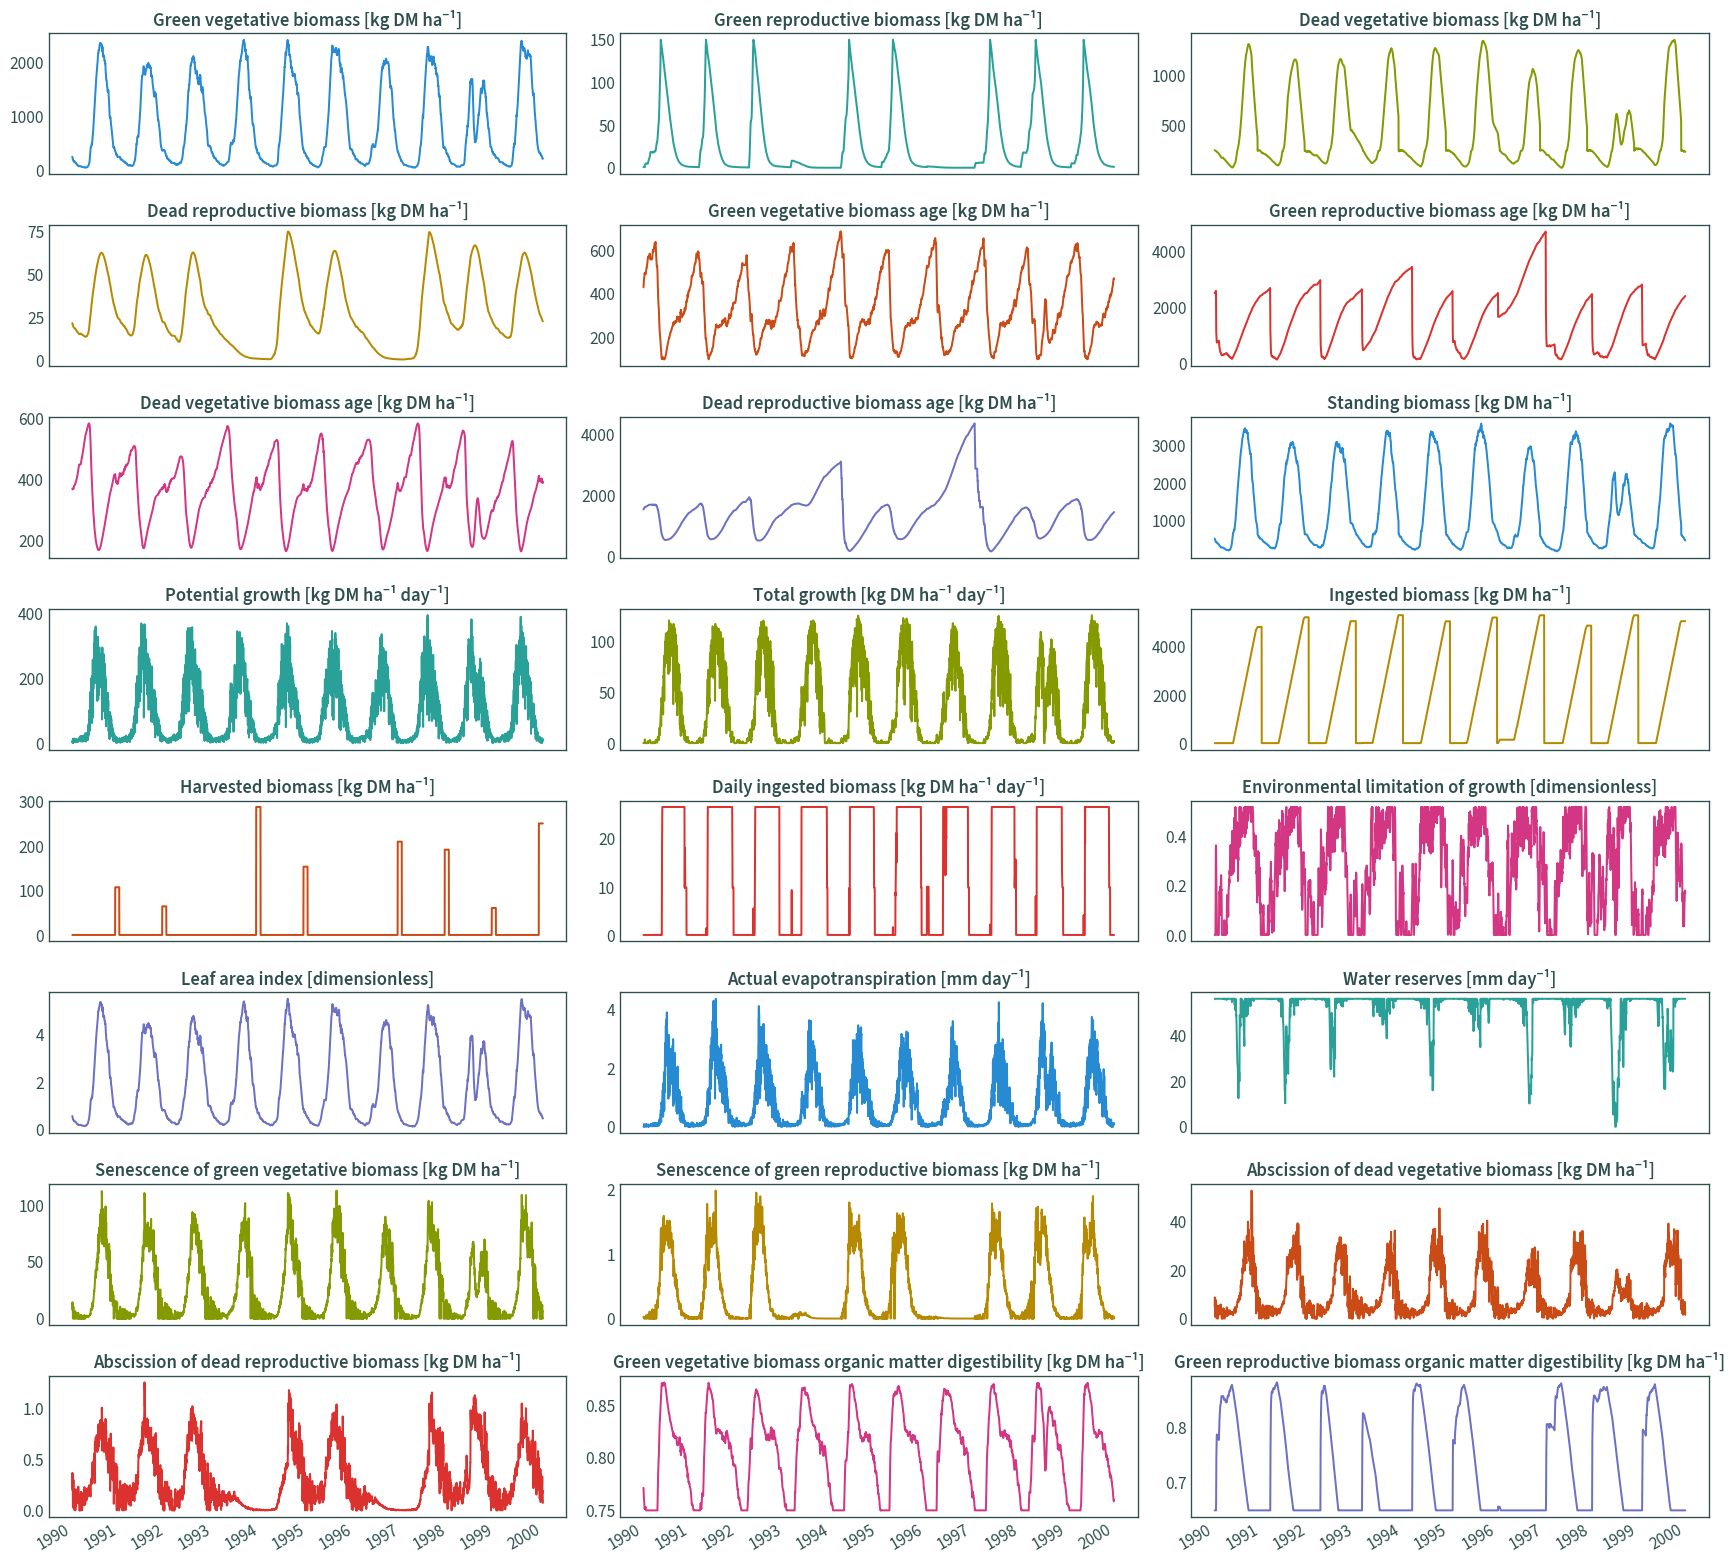
data_ie = data.sel({"rlon": cds[0], "rlat": cds[1]}, method="nearest").sel(
    time=slice("1990", "1999")
)

data_ie_df = pd.DataFrame({"time": data_ie["time"]})

# configure plot title
plot_title = []

for var in data_ie.data_vars:
    data_ie_df[var] = data_ie[var]
    plot_title.append(
        f"{data_ie[var].attrs['long_name']} [{data_ie[var].attrs['units']}]"
    )

data_ie_df.set_index("time", inplace=True)

data_ie_df.plot(
    subplots=True,
    layout=(9, 3),
    figsize=(18, 18),
    legend=False,
    xlabel="",
    title=plot_title,
    linewidth=1,
)

plt.tight_layout()
plt.show()
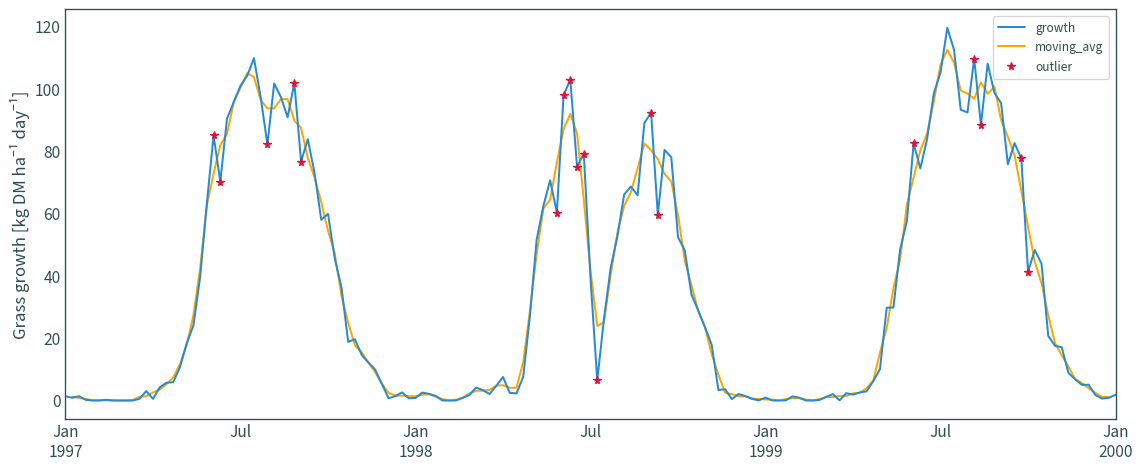
data_ie_y = data_ie.sel(time=slice("1997", "1999"))

data_ie_df = pd.DataFrame({"time": data_ie_y["time"]})

for var in data_ie_y.data_vars:
    data_ie_df[var] = data_ie_y[var]

data_ie_df.set_index("time", inplace=True)
data_ie_df = data_ie_df[["gro"]]

# resample to weekly
data_ie_df = data_ie_df.resample("W-MON").mean()

data_ie_df.reset_index(inplace=True)
mn = data_ie_df.rolling(3, center=True, on="time")["gro"].mean()
data_ie_df["outlier"] = data_ie_df["gro"].sub(mn).abs().gt(10)
data_ie_df["moving_avg"] = mn
data_ie_df.set_index("time", inplace=True)

axs = data_ie_df.plot(y="gro", figsize=(12, 5), xlabel="", label="growth")
data_ie_df.plot(y="moving_avg", ax=axs, color="orange", zorder=1)
if True in list(data_ie_df["outlier"].unique()):
    data_ie_df[data_ie_df["outlier"] == True].plot(
        y="gro",
        ax=axs,
        marker="*",
        linewidth=0,
        color="crimson",
        label="outlier",
    )
plt.xlabel("")
plt.ylabel("Grass growth [kg DM ha⁻¹ day⁻¹]")
plt.tight_layout()
plt.show()