Nitrogen nutritional index - gridded for HiResIreland#
Soil chemical properties based on LUCAS topsoil data (Ballabio et al., 2019; European Commission, n.d.; Panagos et al., 2022; Panagos et al., 2012): https://esdac.jrc.ec.europa.eu/content/chemical-properties-european-scale-based-lucas-topsoil-data
import os
import geopandas as gpd
import matplotlib.pyplot as plt
import rioxarray as rxr
from rasterstats import zonal_stats
DATA_DIR = os.path.join(
    "data",
    "soil",
    "chemical-properties-european-scale-based-lucas-topsoil-data",
)
DATA_FILE = os.path.join(DATA_DIR, "IE_N.tif")
data = rxr.open_rasterio(DATA_FILE, chunks="auto", masked=True)
data
<xarray.DataArray (band: 1, y: 818, x: 835)>
dask.array<open_rasterio-fc87d89a5ce8db95ff48491a55ae131c<this-array>, shape=(1, 818, 835), dtype=float32, chunksize=(1, 818, 835), chunktype=numpy.ndarray>
Coordinates:
  * band         (band) int64 1
  * x            (x) float64 2.918e+06 2.919e+06 ... 3.335e+06 3.335e+06
  * y            (y) float64 3.728e+06 3.728e+06 3.727e+06 ... 3.32e+06 3.32e+06
    spatial_ref  int64 0
Attributes:
    AREA_OR_POINT:           Area
    DataType:                Generic
    RepresentationType:      ATHEMATIC
    STATISTICS_COVARIANCES:  0.9927304438511346
    STATISTICS_MAXIMUM:      15.40726184845
    STATISTICS_MEAN:         2.1118209123088
    STATISTICS_MINIMUM:      0
    STATISTICS_SKIPFACTORX:  1
    STATISTICS_SKIPFACTORY:  1
    STATISTICS_STDDEV:       0.99635859199945
    scale_factor:            1.0
add_offset: 0.0data.rio.crs
CRS.from_epsg(3035)
data.rio.resolution()
(500.0, -500.0)
# Ireland boundary
GPKG_BOUNDARY = os.path.join("data", "boundaries", "boundaries_all.gpkg")
ie = gpd.read_file(GPKG_BOUNDARY, layer="NUTS_RG_01M_2021_2157_IE")
ie.crs
<Derived Projected CRS: EPSG:2157>
Name: IRENET95 / Irish Transverse Mercator
Axis Info [cartesian]:
- E[east]: Easting (metre)
- N[north]: Northing (metre)
Area of Use:
- name: Ireland - onshore. United Kingdom (UK) - Northern Ireland (Ulster) - onshore.
- bounds: (-10.56, 51.39, -5.34, 55.43)
Coordinate Operation:
- name: Irish Transverse Mercator
- method: Transverse Mercator
Datum: IRENET95
- Ellipsoid: GRS 1980
- Prime Meridian: Greenwich
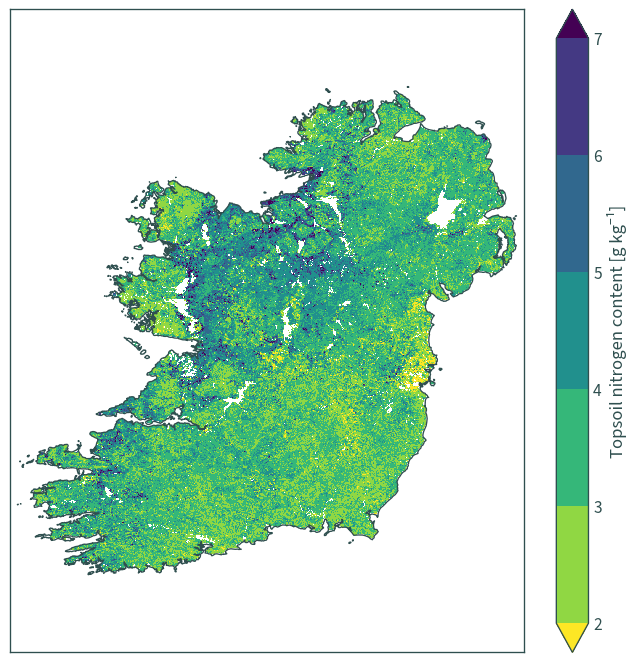
data.max().values
array(9.951199, dtype=float32)
data.min().values
array(1.2719605, dtype=float32)
fig = data.plot(
    robust=True,
    cmap="viridis_r",
    figsize=(7, 7),
    levels=6,
    cbar_kwargs={"label": "Topsoil nitrogen content [g kg⁻¹]"},
)
ie.to_crs(data.rio.crs).boundary.plot(
    ax=fig.axes, color="darkslategrey", linewidth=1
)
plt.title(None)
fig.axes.tick_params(labelbottom=False, labelleft=False)
plt.xlabel(None)
plt.ylabel(None)
plt.tight_layout()
plt.axis("equal")
plt.show()
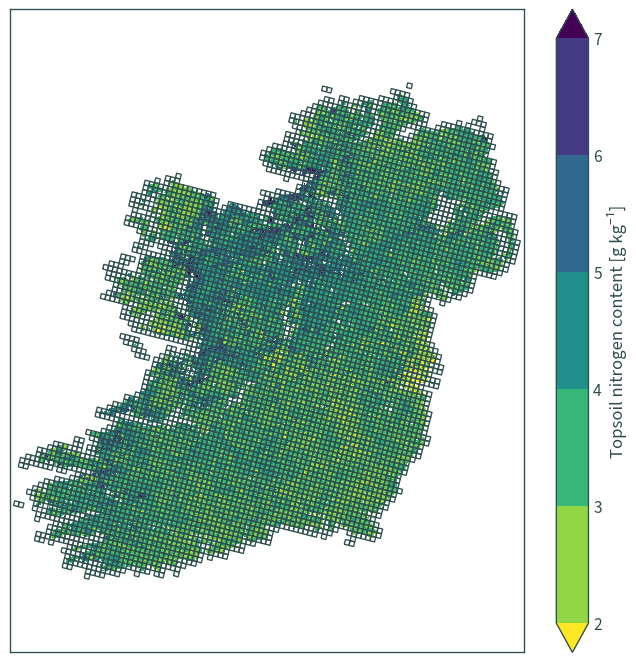
Grid cells#
grid_cells = gpd.read_file(
    os.path.join("data", "ModVege", "params.gpkg"), layer="hiresireland"
)
grid_cells.head()
| rlon | rlat | sr | geometry | |
|---|---|---|---|---|
| 0 | -1.680 | -1.315 | 0.917024 | POLYGON ((417558.169 590305.235, 417549.771 59... |
| 1 | -1.680 | -1.280 | 0.917024 | POLYGON ((417549.771 594200.519, 417541.440 59... |
| 2 | -1.645 | -1.595 | 0.763591 | POLYGON ((421531.348 559152.004, 421522.478 56... |
| 3 | -1.645 | -1.315 | 0.917024 | POLYGON ((421462.259 590312.894, 421453.924 59... |
| 4 | -1.645 | -1.280 | 0.917024 | POLYGON ((421453.924 594208.112, 421445.655 59... |
grid_cells.crs
<Derived Projected CRS: EPSG:2157>
Name: IRENET95 / Irish Transverse Mercator
Axis Info [cartesian]:
- E[east]: Easting (metre)
- N[north]: Northing (metre)
Area of Use:
- name: Ireland - onshore. United Kingdom (UK) - Northern Ireland (Ulster) - onshore.
- bounds: (-10.56, 51.39, -5.34, 55.43)
Coordinate Operation:
- name: Irish Transverse Mercator
- method: Transverse Mercator
Datum: IRENET95
- Ellipsoid: GRS 1980
- Prime Meridian: Greenwich
grid_cells.shape
(6118, 4)
fig = data.plot(
    robust=True,
    cmap="viridis_r",
    figsize=(7, 7),
    levels=6,
    cbar_kwargs={"label": "Topsoil nitrogen content [g kg⁻¹]"},
)
grid_cells.to_crs(data.rio.crs).boundary.plot(
    ax=fig.axes, color="darkslategrey", linewidth=1
)
plt.title(None)
fig.axes.tick_params(labelbottom=False, labelleft=False)
plt.xlabel(None)
plt.ylabel(None)
plt.tight_layout()
plt.axis("equal")
plt.show()
Zonal stats#
grid_cells = gpd.GeoDataFrame.from_features(
    zonal_stats(
        vectors=grid_cells.to_crs(data.rio.crs),
        raster=os.path.join(DATA_DIR, "IE_N.tif"),
        stats=["count", "mean"],
        geojson_out=True,
    ),
    crs=data.rio.crs,
).to_crs(grid_cells.crs)
grid_cells.head()
| geometry | rlon | rlat | sr | count | mean | |
|---|---|---|---|---|---|---|
| 0 | POLYGON ((417558.169 590305.235, 417549.771 59... | -1.680 | -1.315 | 0.917024 | 0 | NaN |
| 1 | POLYGON ((417549.771 594200.519, 417541.440 59... | -1.680 | -1.280 | 0.917024 | 0 | NaN |
| 2 | POLYGON ((421531.348 559152.004, 421522.478 56... | -1.645 | -1.595 | 0.763591 | 0 | NaN |
| 3 | POLYGON ((421462.259 590312.894, 421453.924 59... | -1.645 | -1.315 | 0.917024 | 0 | NaN |
| 4 | POLYGON ((421453.924 594208.111, 421445.655 59... | -1.645 | -1.280 | 0.917024 | 0 | NaN |
grid_cells.shape
(6118, 6)
grid_cells["mean"].min()
1.761827422351372
grid_cells["mean"].max()
7.460216946072048
grid_cells["count"].min()
0
grid_cells["count"].max()
64
grid_cells[grid_cells["count"] == 0]
| geometry | rlon | rlat | sr | count | mean | |
|---|---|---|---|---|---|---|
| 0 | POLYGON ((417558.169 590305.235, 417549.771 59... | -1.680 | -1.315 | 0.917024 | 0 | NaN |
| 1 | POLYGON ((417549.771 594200.519, 417541.440 59... | -1.680 | -1.280 | 0.917024 | 0 | NaN |
| 2 | POLYGON ((421531.348 559152.004, 421522.478 56... | -1.645 | -1.595 | 0.763591 | 0 | NaN |
| 3 | POLYGON ((421462.259 590312.894, 421453.924 59... | -1.645 | -1.315 | 0.917024 | 0 | NaN |
| 4 | POLYGON ((421453.924 594208.111, 421445.655 59... | -1.645 | -1.280 | 0.917024 | 0 | NaN |
| ... | ... | ... | ... | ... | ... | ... |
| 6103 | POLYGON ((756735.711 882973.333, 756728.348 88... | 1.365 | 1.310 | 2.021384 | 0 | NaN |
| 6104 | POLYGON ((760717.627 840119.590, 760710.879 84... | 1.400 | 0.925 | 2.126344 | 0 | NaN |
| 6113 | POLYGON ((764608.869 847919.894, 764601.966 85... | 1.435 | 0.995 | 2.685055 | 0 | NaN |
| 6114 | POLYGON ((764601.966 851816.404, 764595.002 85... | 1.435 | 1.030 | 2.685055 | 0 | NaN |
| 6117 | POLYGON ((764580.889 863506.071, 764573.741 86... | 1.435 | 1.135 | 2.497536 | 0 | NaN |
290 rows × 6 columns
axs = grid_cells.plot(
    column="mean",
    cmap="Spectral_r",
    scheme="equal_interval",
    edgecolor="darkslategrey",
    linewidth=0.2,
    figsize=(6, 7),
    legend=True,
    legend_kwds={
        "loc": "upper left",
        "fmt": "{:.2f}",
        "title": "Topsoil N [g kg⁻¹]",
    },
    missing_kwds={
        "color": "darkslategrey",
        "edgecolor": "darkslategrey",
        "label": "No data",
    },
)
for legend_handle in axs.get_legend().legend_handles:
    legend_handle.set_markeredgewidth(0.2)
    legend_handle.set_markeredgecolor("darkslategrey")
axs.tick_params(labelbottom=False, labelleft=False)
plt.axis("equal")
plt.tight_layout()
plt.show()

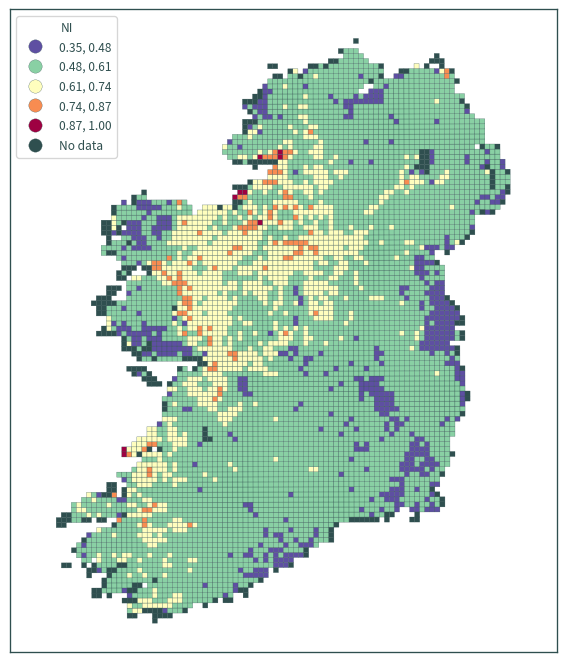
Normalise#
# normalise between 1.0 and 0.35
grid_cells["ni"] = 0.35 + (
    (grid_cells["mean"] - float(grid_cells["mean"].min())) * (1.0 - 0.35)
) / (float(grid_cells["mean"].max()) - float(grid_cells["mean"].min()))
grid_cells.head()
| geometry | rlon | rlat | sr | count | mean | ni | |
|---|---|---|---|---|---|---|---|
| 0 | POLYGON ((417558.169 590305.235, 417549.771 59... | -1.680 | -1.315 | 0.917024 | 0 | NaN | NaN |
| 1 | POLYGON ((417549.771 594200.519, 417541.440 59... | -1.680 | -1.280 | 0.917024 | 0 | NaN | NaN |
| 2 | POLYGON ((421531.348 559152.004, 421522.478 56... | -1.645 | -1.595 | 0.763591 | 0 | NaN | NaN |
| 3 | POLYGON ((421462.259 590312.894, 421453.924 59... | -1.645 | -1.315 | 0.917024 | 0 | NaN | NaN |
| 4 | POLYGON ((421453.924 594208.111, 421445.655 59... | -1.645 | -1.280 | 0.917024 | 0 | NaN | NaN |
grid_cells["ni"].max()
1.0
grid_cells["ni"].min()
0.35
axs = grid_cells.plot(
    column="ni",
    cmap="Spectral_r",
    scheme="equal_interval",
    edgecolor="darkslategrey",
    linewidth=0.2,
    figsize=(6, 7),
    legend=True,
    legend_kwds={"loc": "upper left", "fmt": "{:.2f}", "title": "NNI"},
    missing_kwds={
        "color": "darkslategrey",
        "edgecolor": "darkslategrey",
        "label": "No data",
    },
)
for legend_handle in axs.get_legend().legend_handles:
    legend_handle.set_markeredgewidth(0.2)
    legend_handle.set_markeredgecolor("darkslategrey")
axs.tick_params(labelbottom=False, labelleft=False)
plt.axis("equal")
plt.tight_layout()
plt.show()
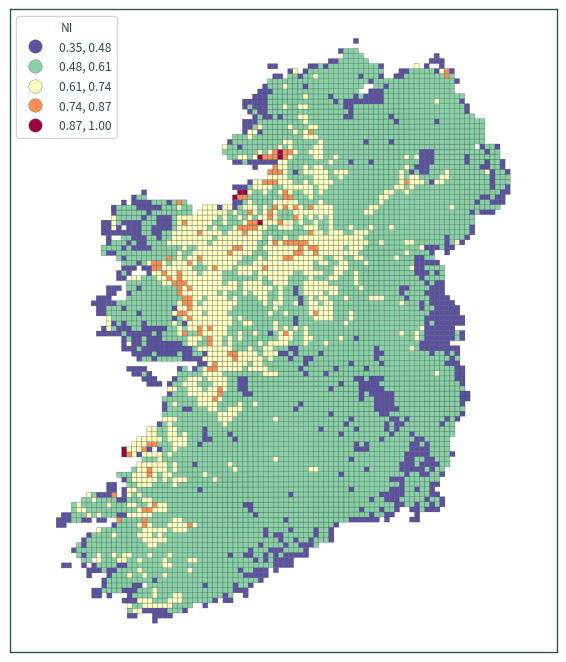
# fill no data with min value
grid_cells["ni"] = grid_cells["ni"].fillna(grid_cells["ni"].min())
grid_cells.head()
| geometry | rlon | rlat | sr | count | mean | ni | |
|---|---|---|---|---|---|---|---|
| 0 | POLYGON ((417558.169 590305.235, 417549.771 59... | -1.680 | -1.315 | 0.917024 | 0 | NaN | 0.35 |
| 1 | POLYGON ((417549.771 594200.519, 417541.440 59... | -1.680 | -1.280 | 0.917024 | 0 | NaN | 0.35 |
| 2 | POLYGON ((421531.348 559152.004, 421522.478 56... | -1.645 | -1.595 | 0.763591 | 0 | NaN | 0.35 |
| 3 | POLYGON ((421462.259 590312.894, 421453.924 59... | -1.645 | -1.315 | 0.917024 | 0 | NaN | 0.35 |
| 4 | POLYGON ((421453.924 594208.111, 421445.655 59... | -1.645 | -1.280 | 0.917024 | 0 | NaN | 0.35 |
axs = grid_cells.plot(
    column="ni",
    cmap="Spectral_r",
    scheme="equal_interval",
    edgecolor="darkslategrey",
    linewidth=0.2,
    figsize=(6, 7),
    legend=True,
    legend_kwds={"loc": "upper left", "fmt": "{:.2f}", "title": "NNI"},
    missing_kwds={
        "color": "darkslategrey",
        "edgecolor": "darkslategrey",
        "label": "No data",
    },
)
for legend_handle in axs.get_legend().legend_handles:
    legend_handle.set_markeredgewidth(0.2)
    legend_handle.set_markeredgecolor("darkslategrey")
axs.tick_params(labelbottom=False, labelleft=False)
plt.axis("equal")
plt.tight_layout()
plt.show()
grid_cells.drop(columns=["mean", "count"], inplace=True)
grid_cells.to_file(
    os.path.join("data", "ModVege", "params.gpkg"), layer="hiresireland"
)